A snapshot of Northwest power supply and electricity
demand.
For more information, contact John
Fazio.
Power Supply Outlook Update
February 2009 Summary: The likelihood of a significant
power shortage over the next five years due to an inadequate supply
continues to be minimal. Based on the 2008
Assessment
(330k Word) the region’s annual supply of energy from
existing sources is projected to be about 1,900 average megawatts
over the minimum adequacy threshold by 2013. Winter has typically
been the period of greatest concern for the region, however, due to
increasing air conditioning demands, reductions in hydroelectric
capability and competition for West-wide supplies, summer months now
show the narrowest gap between supply and demand. By 2013 summer
surplus peaking capacity is projected to be 1,400 megawatts over the
minimum threshold.
Although the risk of a major supply shortage is minimal,
utilities are actively pursuing new resource and conservation
acquisitions to meet their individual needs, to satisfy state
mandated renewable resource requirements and to minimize dependence
on market supplies. The Council is currently developing its
Sixth Power Plan for the
region, which will address these and other issues. The draft plan
should be available in May of 2009 for public review and comment.
Columbia River runoff volume forecast
|
|
Updated biweekly between January and July
Last updated
|
| |
| Figures in million acre-feet |
Low |
Avg |
High |
| [Data temporarily unavailable] |
| 60-year history |
53 |
107 |
159 |
|
|
January to July runoff at the Dalles Dam is at [n/a] of the 30-year average from 1971-2000.
For more narrative information, see the National
Weather Service Northwest River Forecast Center. For more data
including runoff history, see BPA
Hydrology.
|
Reservoir elevations and flows
|
|
Updated daily
|
| |
|
|
|
|
[reservoir elevations temporarily unavailable]
|
|
The 1st table lists elevations for major U.S.
reservoirs.
The 2nd table lists river flow at key Lower Snake and Columbia
dams. |
New Northwest generating resources
|
|
Updated quarterly
Last updated Feb 2009
|
New resources either
recently online or coming online soon.
See how much Northwest power comes from hydropower
vs other sources.
|
| Project |
Location |
Type |
Capacity (MW) |
Energy (MWa) |
Service Date |
Note |
|
Under construction
|
| Echo |
Morrow/Umatilla Co., OR |
Windpower |
65 |
|
July 2009 |
Est. energy |
| Pebble Springs |
Arlington, OR |
Windpower |
99 |
32 |
Q1 2009 |
Est. energy |
| Simpson Tacoma Cogen |
Tacoma, WA |
Wood residue steam cogen |
55 |
46 |
Aug 2009 |
Est. energy |
| Wheat Field |
Arlington, OR |
Windpower |
97 |
28 |
Jun 2009 |
Est. energy |
| Willow Creek |
Arlington, OR |
Windpower |
72 |
23 |
Feb 2009 |
Est. energy |
| Windy Point |
Goldendale, WA |
Windpower |
136 |
|
May 2008 |
Est. energy |
|
Recently in-service
(last 12 months) |
Danskin CT1 |
Mountain Home, ID |
Natural gas simple cycle gas turbine |
170 |
As dispatched |
Jun 2008 |
|
| Diamond Willow |
Fallon Co, MT |
Windpower |
20 |
6 |
Jun 2008 |
In MRO reliability area; Est. energy |
| Glacier Wind Energy |
Toole/Glacier Cty, MT |
Windpower |
107 |
34 |
Oct 2008 |
Est. energy |
| Goodnoe Hills |
Klickitat Co., WA |
Windpower |
94 |
30 |
Jun 2008 |
Est. energy |
| Grays Harbor |
Satsop, WA |
Natural gas combined-cycle gas turbine |
650 |
As dispatched |
Jul 2008 |
|
| Hay Canyon |
Wasco, OR |
Windpower |
100 |
|
Dec 2008 |
Est. energy |
| Klondike III |
Wasco Co., OR |
Windpower |
221 |
71 |
Mar 2008 |
Est. energy |
| Klondike IIIA |
Wasco Co., OR |
Windpower |
77 |
25 |
Sept 2008 |
Est. energy |
| Marengo II (Dayton) |
Columbia Co., WA |
Natural gas combined-cycle gas turbine |
70 |
23 |
Jun 2008 |
Est. energy |
| Mint Farm |
Longview, WA |
Natural gas combined-cycle gas turbine |
319 |
As dispatched |
Jan 2008 |
Est. energy |
| Raft River |
Cassia Co. ID |
Geothermal |
16 |
12 |
Jan 2008 |
Est. energy |
| Rattlesnake Road |
Gilliam Co., OR |
Windpower |
103 |
33 |
Dec 2009 |
Est. energy |
More detail > (~350k
Excel)
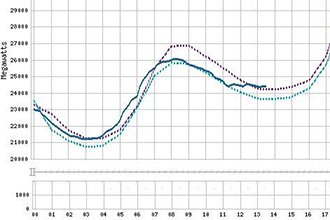
Power flow in and out of the region
|
|
Updated daily
Current period: 18FEB10-19MAR10
|
| |
|
|
|
Intertie |
Avg power flow |
Direction |
| California (AC+DC) |
1729 mw |
export to California |
| Canada (BC) |
446 mw |
export to Canada |
| Total |
2175 mw |
export |
|
|
This shows how much average power has been imported
and exported in the last 30 days.
For more information, see Bonneville's
intertie analyses
|
Acronyms and glossary
DSI - Direct Service Industry, like aluminum processors
intertie - high-voltage transmission lines connecting the Northwest
to other regions
KCFS - thousand cubic feet per second
load - demand
MAF - million acre-feet
MW - megawatt
NMFS - National Marine Fisheries Service |
More Power Supply reports