


The resource needs assessment is valuable because it gives planners an indication of the range of potential energy and capacity needs the region may need over the next 20 years. Of course, the Council’s resource strategy, which is developed with the aid of the Regional Portfolio Model (RPM), is a much more robust and adaptable plan that covers a wider range of future uncertainties. To better ensure that the RPM will produce a resource strategy that does not violate the Council’s 5 percent LOLP adequacy standard and does not significantly overbuild, the energy and capacity needs identified in the GENESYS model are converted into adequacy reserve margins, which are used in the RPM as minimum resource build requirements.
The Adequacy Reserve Margin (ARM) is a factor that permits the adequacy standard, as tested in the GENESYS model, to be incorporated into the Regional Portfolio Model’s resource development logic. In simple terms, is the amount of additional capacity and energy, relative to expected demand, required to maintain an adequate power supply. It is like the planning reserve margin that utilities often use for long-term resource planning, except that the ARM is based on a probabilistic calculation of potential curtailments under uncertain future conditions. The ARM is measured in units of percent and is defined[1] as the difference between the generating capability of existing system resources and expected demand divided by the demand, for a system that just meets the Council’s adequacy standard.
ARMs are calculated for each season (quarter) and are affected by resource mix and by demand shape. The ARMs for both energy and capacity are fed into the RPM as minimum build requirements for adequacy. In other words, as the RPM steps through the study horizon years, it will try to build sufficient resources to ensure that the minimum ARM requirements for both energy and capacity are met.
Since the ARM thresholds are derived from a stochastic GENESYS study that produces an exactly adequate system (i.e., exactly meets the 5% LOLP target), the theory is that acquiring sufficient new resource capacity and energy to meet the ARM thresholds will result in a supply that, when checked in GENESYS, will yield a 5% LOLP.
ARM studies using climate change data are run over 300 games using only decadal projections for temperatures (loads) and stream flows. For example, 2031 ARMs use climate change data from 2030-39 and 2023 and 2027 ARMs use climate change data from 2020-29. The climate change water and load years are run sequentially in lockstep (even though water/load year combinations repeat, other random variables such as forced outages, wind and solar generation will vary by sequence). The number of games needed to produce stable results is lower for CC studies because water and temperature years are run in lockstep.
Studies include both in-region (independent power producers) and out-of-region market supplies, but those resources are not included in the ARM calculations[2]. In addition, some existing standby resources (demand response, pumped storage, and small emergency generators) are also not included in the ARM calculations.
For hydro capacity and energy contributions, the 3.33rd percentile quarterly 2-hour sustained peak and the 3.33rd percentile quarterly average energy are used. Thermal resource capacity used is equal to the nameplate capacity multiplied by (1 – FOR), where FOR is the forced outage rate. Thermal resource availability used is equal to the product of the nameplate capacity, (1 – FOR) and (1 – MOR), where MOR is the maintenance outage rate.
Capacity contributions for existing wind, solar and batteries are based on their expected generation over the two contiguous peak-load hours for each quarter. For the ARMs, these capacity contributions are simpler to calculate, as opposed to using their effective load carrying capability (ELCC) or their associated system capacity contribution (ASCC) and produce viable ARM results – as long as the same numbers are used in the RPM for these existing resources. The energy contributions for all existing resources used to calculate the energy ARMs are simply their expected quarterly energy production.
The amounts of additional capacity and energy needed for adequacy are calculated by aggregating quarterly peak-hour and energy curtailment duration curves and then estimating the amount of capacity and energy needed in each quarter to meet the quarterly LOLP targets. If the LOLP in the quarter being analyzed is below the LOLP target, then the capacity ARM threshold is set to zero.
It should be noted that ARM values can be negative, depending on how resources are counted. For example, because we count only the 3.3 percentile hydro capacity and energy, it is possible that ARM values will be negative. The correct interpretation of negative ARMs is that the power supply can be adequate (as defined by the LOLP standard) even though its load/resource balance under extremely poor hydro conditions is deficit.
The Adequacy Reserve Margins used for Regional Portfolio simulations are calculated in the files linked below:
- Baseline
- Early Coal Retirement
- Emissions Pricing
- Increased Market Reliance
- No Gas Build Limits
- Limited Markets
- Organized Markets
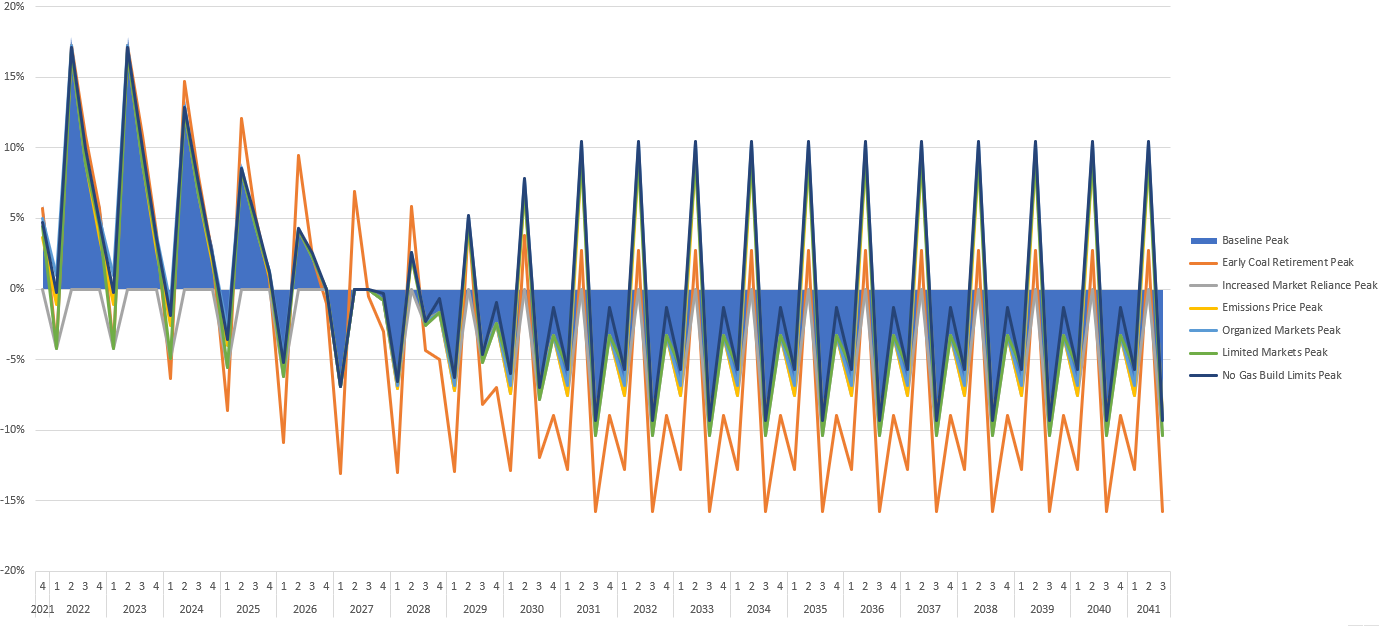
One of the key characteristics in all scenarios in the peak adequacy reserve margin results shown below reflects the capability of the regional hydro to absorb and reshape the increasing surplus energy from the WECC-wide market and use it to meet regional peak needs.
Peak ARM Comparison
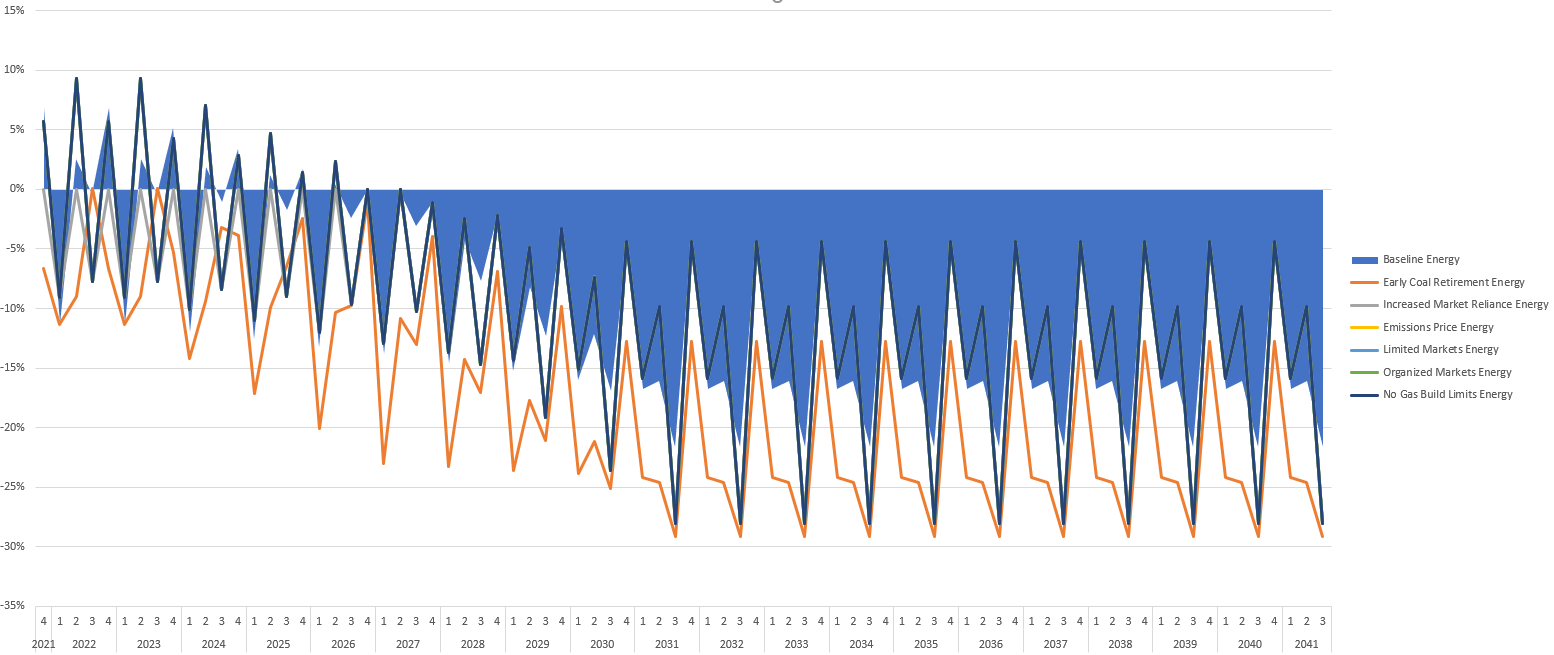
One of the key characteristics in all scenarios in the energy adequacy reserve margin results shown below reflects the capability of the regional hydro to absorb and reshape the increasing surplus energy from the WECC-wide market and use it to meet regional energy needs.
Energy ARM Comparison
While the adequacy reserve margins are specific metrics to translate the needs identified in GENESYS simulations into a reserve margin input that the RPM can utilize to dynamically assess needs under different futures, the ARMs are not necessarily always intuitive. To assist in interpreting the above ARM and broader needs assessment results the following file catalogues a number of frequency, magnitude and duration adequacy metrics referenced in the adequacy overview.
Adequacy Overview Supporting Data
[1] As discussed in the February System Analysis Advisory Committee meeting
[2] See the spreadsheets associated with the needs assessment for each scenario.