


The Council’s long-term load forecast includes an outlook for behind the meter (BTM) solar installations and generation in the region. In this section, solar refers to photovoltaic systems (PV), typically rooftop mounted, but not exclusively, in the residential, commercial and industrial sectors. This is also referred to as distributed solar.
Solar panels are relatively simple to install and operate on homes and businesses. Emission-free self-generation enables the electricity consumer the ability to directly participate in the clean-energy industry. In addition, the cost to install and operate home solar has declined and the production efficiency has improved; these trends are expected to continue.
For the 2021 Power Plan, there were two primary components to our work:
- The creation of a solar generation profile dataset for the Northwest
- A forecast of installed solar cost, installed capacity, and generation
Solar Generation Profiles across the Northwest
Solar generation profiles – hourly capacity factors for a single year – were generated and compiled for over 60 cities and towns across the Northwest using the National Renewable Energy Laboratory (NREL) System Advisor Model (SAM)[1]. An hourly capacity factor is calculated as the ratio of the generation in that hour to the installed PV capacity.
The SAM solar model was set up with a typical residential PV system, the standard model settings, and typical meteorological year (TMY) weather. State-level solar profiles were developed by weighting the individual city profiles by their population. A region-wide profile for the Northwest was calculated by weighting the individual state profiles by population.
Overall, Idaho has the best solar resource in the region as evidenced by annual capacity factors.
Annual Solar Capacity Factors by State
| Idaho | Montana | Oregon | Washington | Northwest Region | |
| Capacity Factor | 0.202 | 0.185 | 0.166 | 0.163 | 0.170 |
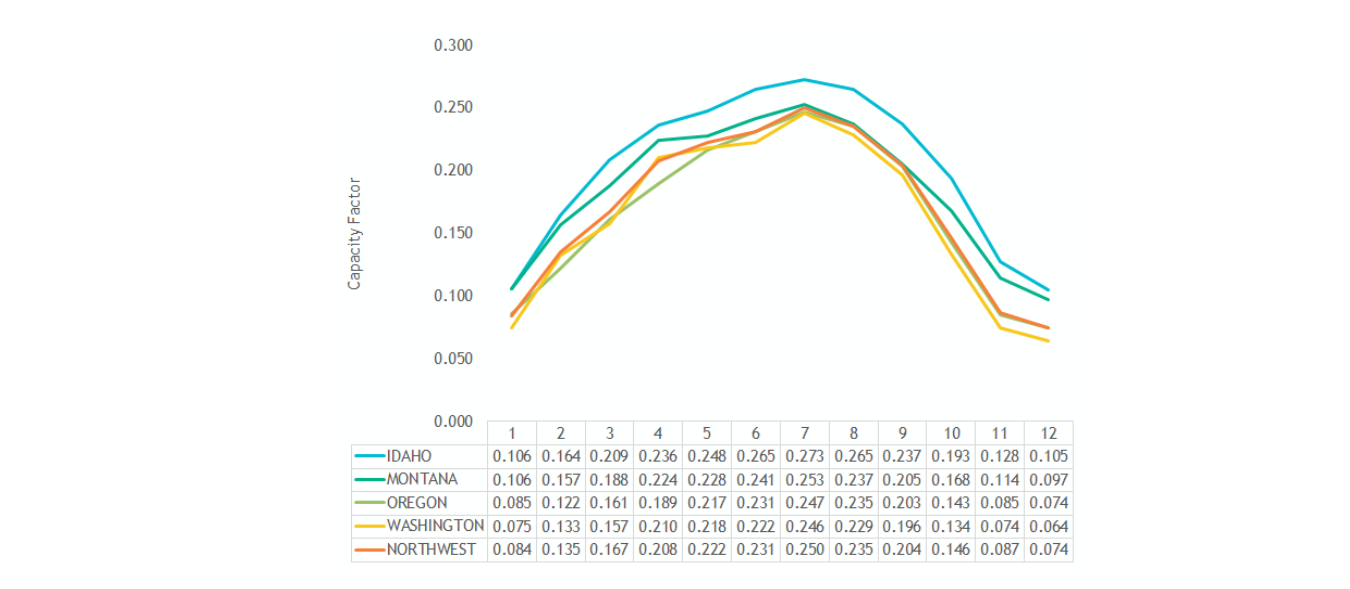
Seasonally, the solar resource peaks in summer, with July the best month, and is weakest in the winter, with December the low month.
Monthly Solar Capacity Factors by State
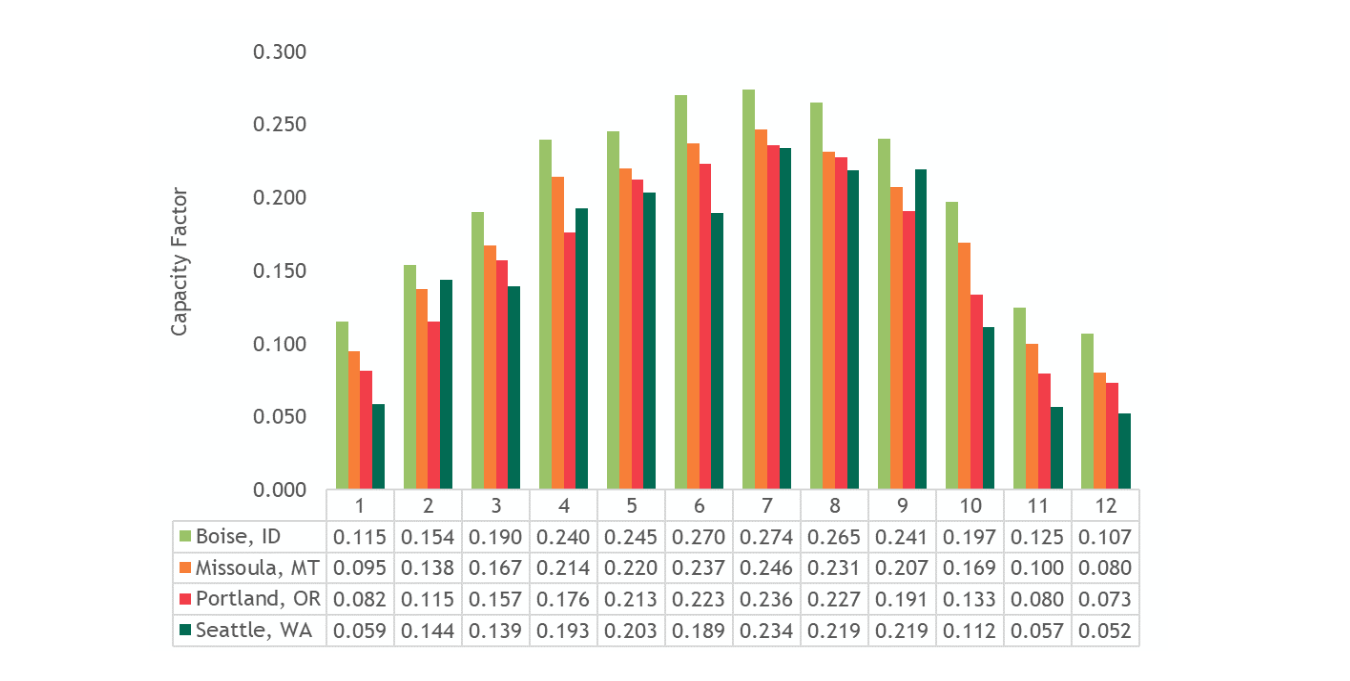
For utility-scale solar, sparsely populated areas like southern Idaho and the eastern portions of Oregon and Washington offer the best solar resource, assuming transmission is available. However, for distributed or BTM solar, larger cities offer more rooftop space to set up distributed solar systems and are key to behind the meter generation in the region. Boise is the largest city in Idaho and offers a strong solar resource. For Oregon and Washington, much of the population is west of the Cascades, which has a less productive solar resource. The following figure displays estimates of the capacity factors for select cities.
Monthly Solar Capacity Factors by City
The regional data set is available here: File - SolarProfile_DataSet.xlsx
Additional state profile data sets are available here: Folder - StateProfileDataSet
Forecast of Installed Capacity and Generation
Forecast Methodology
The key inputs to the long-term forecasting model include:
Historic capacity installations (kW) by sector (Res/Com/Ind)
- Historic and future installation cost ($/kW)
- Historic solar generation (kWh)
- Historic and future price of retail electricity ($/kWh)
- Economic drivers
The model calibrates historic installation quantities with the cost estimates for solar and retail electricity. The future cost of solar in relation to retail electricity prices, and the economic drivers strongly influence the forecast of future installations.
The State Energy Data System (SEDS)[2], maintained by the EIA, provides information on past solar installation and generation in the region. Additional EIA data tools[3] were used to further hone the historic data. The cost inputs are covered next.
Cost Forecast
An estimate was made of the historic solar installation costs, as well as a forecast of future costs. These cost values – in $ per kW AC – are input into the long-term forecast model. The model uses the historic information of installed capacity and cost estimates to set customer preferences. The forecast of future costs is a significant driver for the outlook of new solar capacity installations.
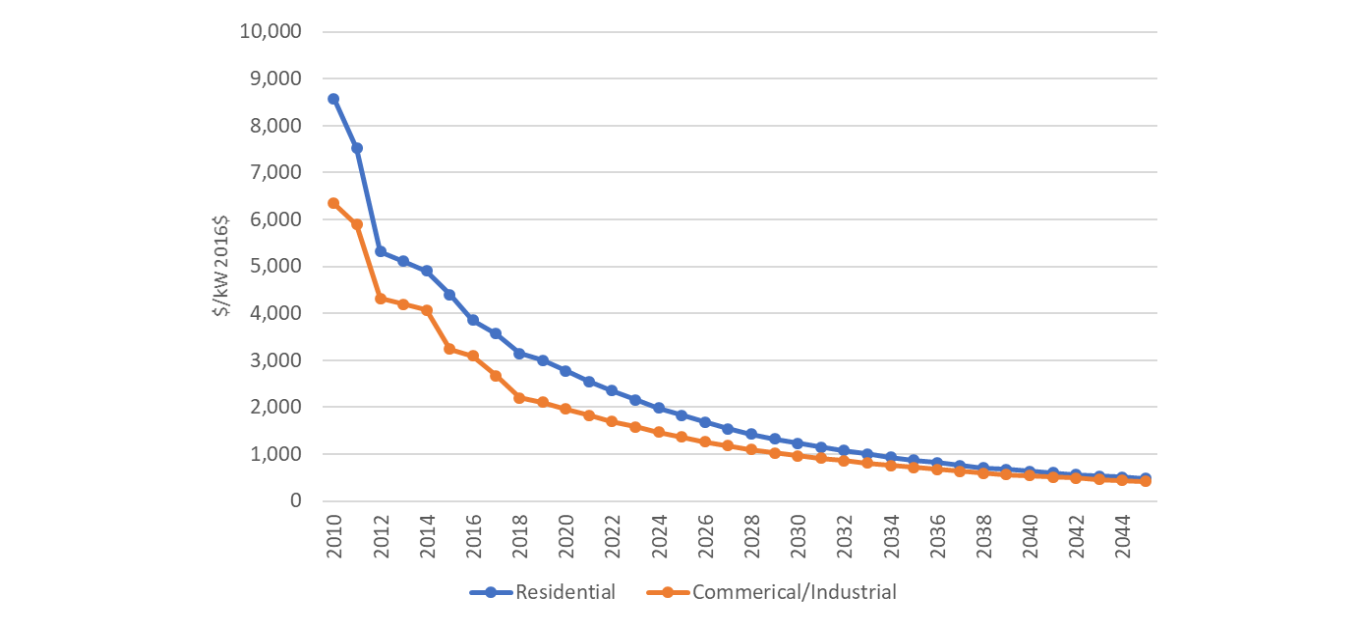
Since 2010, the costs for solar have declined each year. PV module costs have consistently declined, while module efficiency has increased. Component and installation costs have declined as well. The cost for buying and installing a PV system is expected to continue to decline at a rate of 7% per year. Several sources were used to create the estimate of historic costs, and forecast trends, including the National Renewable Energy Lab (NREL) and Greentech Media (GTM). Additional information on solar may be found on the Council’s Generating Resource Advisory Committee (GRAC) webpage.[4]
Historic and Forecast – Solar Cost $/kW
Forecast Results
Behind-the-meter solar installations in the Northwest have tripled in the five years from 2014 through 2018. By the end of 2018, nearly 90% of the 326 MW of overall capacity in the region was installed in Oregon and Washington.
Historic Behind-the-Meter Solar Capacity by State
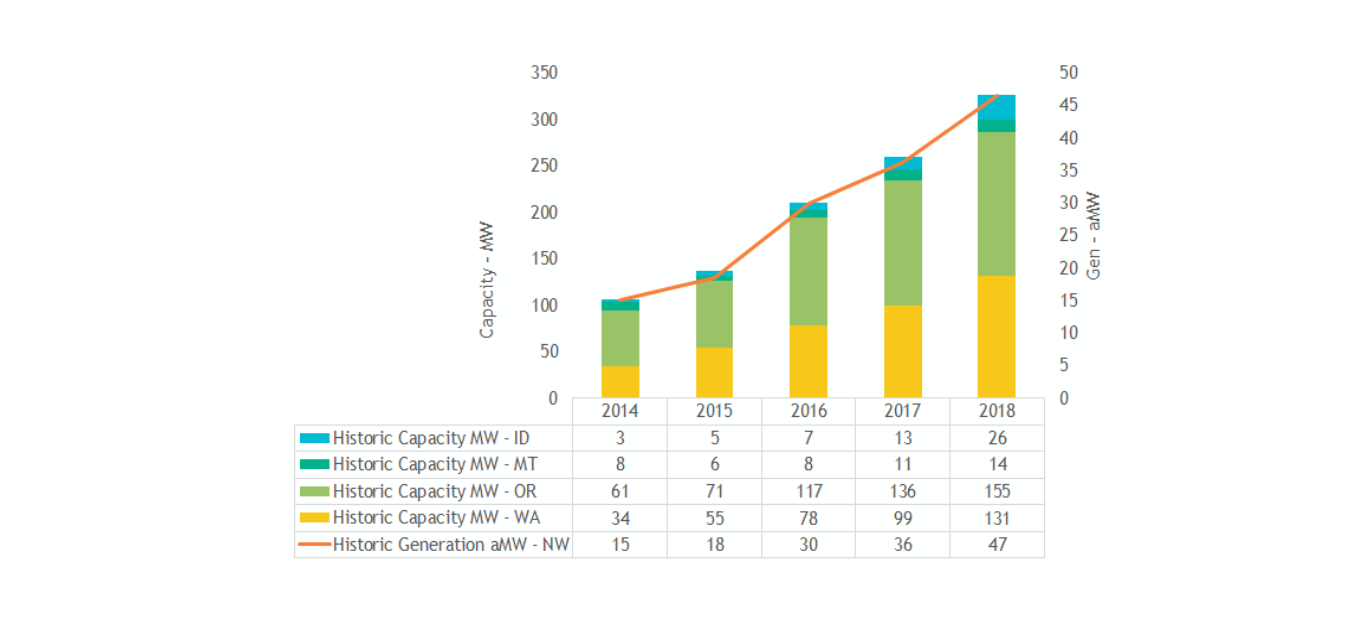
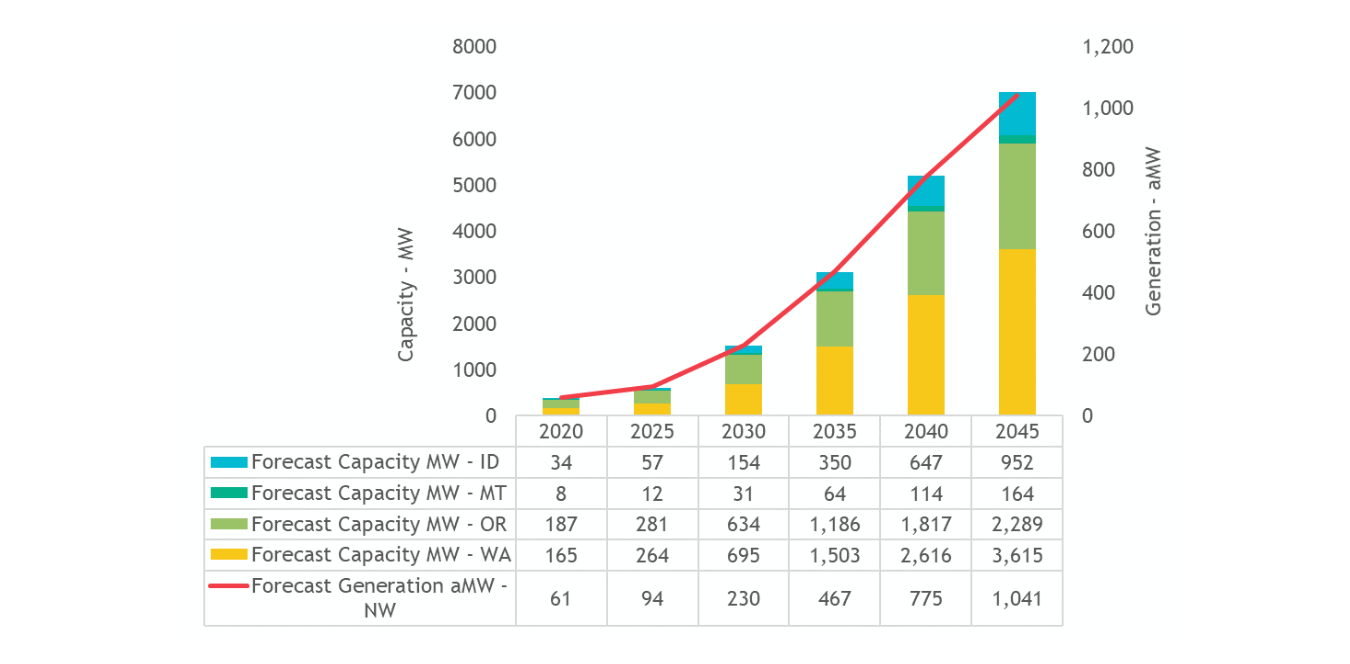
The following figure shows the forecast of capacity and the associated generation (on other scale) by state. The outlook for solar from our model resembles a fairly aggressive hockey-stick type forecast. Solar installations are not dependent on stock turnover, and the cost to install is expected to continue to decline each year, so growth could be rapid.
Forecast of Behind-the-Meter Solar Capacity and Generation by State
The majority of solar installations are in the residential space. The next two tables breakout the historic and forecast solar capacity installations.
Historic Behind-the-Meter Solar Capacity by Sector
| Sector | 2014 | 2015 | 2016 | 2017 | 2018 |
| Residential | 65 | 92 | 131 | 169 | 222 |
| Commercial | 39 | 42 | 69 | 78 | 92 |
| Industrial | 2 | 3 | 10 | 10 | 11 |
| All | 106 | 137 | 210 | 258 | 326 |
Forecast of Behind-the-Meter Solar Capacity by Sector
| Sector | 2020 | 2025 | 2030 | 2035 | 2040 | 2045 |
| Residential | 275 | 444 | 1,182 | 2,550 | 4,375 | 5,920 |
| Commercial | 105 | 154 | 299 | 491 | 709 | 932 |
| Industrial | 13 | 17 | 32 | 61 | 110 | 168 |
| All | 394 | 615 | 1,513 | 3,103 | 5,194 | 7,019 |
Additional forecast data is available here
[2] https://www.eia.gov/state/seds/
[3] https://www.eia.gov/electricity/data/eia861m/#ammeter
[4] https://www.nwcouncil.org/energy/energy-advisory-committees/generating-resources-advisory-committee/