The Northwest Power and Conservation Council publishes a forecast of coal prices for every power plan. For the 2021 Power Plan, a new delivered price model and forecast was developed for the regional coal power plants. The forecast is used in Council planning models such as MicroFin, RPM, and Aurora, as well as by regional stakeholders.
We will begin with some background on coal. There are four basic classifications of coal depending on their carbon content and related heating value.
- Anthracite – 86% to 97% carbon, less than 1% of coal that is mined in the US
- Bituminous – 45% to 86% carbon
- Subbituminous – 35% to 45% carbon, nearly all from Wyoming (has lower SO2 content)
- Lignite – lowest carbon content
The power plants in the Northwest rely on coal mined from the Wyoming Powder River Basin (PRB), which is category 3 – subbituminous.
Coal mining can be broken into two categories, underground and surface. Surface mining occurs when coal seams are near the surface (less than 200 feet down) – this accounts for 65% of US production. The Wyoming PRB has a 70-foot coal seam close to the surface. Train cars are used to transport around 70% of all coal deliveries in the US.
The mining and combustion of coal results in emissions which contribute to acid rain, respiratory illness, smog, and climate change. These emissions include:
- SO2
- NOx
- Particulates
- Fly Ash
- Mercury
- CO2
- CH4
Other key coal facts:
- Recent spot prices for Power River Basin coal are around $12.30 per short ton (June 2019).
- The average sales prices in the US was $33.72 per short ton
- Wyoming is the largest producing state
- The largest producing mine is the North Antelope Rochelle Mine/Peabody PRB Mining LLC -accounts for 13% of the coal produced in the US in 2017. This is in NE Wyoming – near Gillette
As mentioned earlier, a new price forecasting model was developed for the 2021 Power Plan. This model delivers three products (all prices in units of $/MMBtu 2016$)
- Price forecast at the point of sale from the Powder River Basin
- A transportation cost forecast to deliver coal to power plants in the states of Montana, Oregon and Washington
- A delivered price forecast – which combines the sales price and transportation cost
In addition to a reference forecast, a high and low-price forecast is also developed based off the sales price forecast component.
First, a data set of 10 years of recent historic delivered coal prices for the states of Montana, Oregon and Washington was collected[1]. This data reflects the combined purchase price and transportation cost for regional power plants and is reported on $ per short ton basis. The historic coal sales price at Wyoming PRB was collected from the EIA site as well. The delta between the delivered price and sales price is used to represent the historic transport cost. A model fit was used to reflect the trend in transportation costs over time:
Ci,s = a*LN(i) + b
Where C is the transportation cost ($/ST) in year i and s = state.
The price forecast for sales at PRB was derived from the EIA’s 2019 Annual Energy Outlook. The reference case was used to set the medium forecast, the EIA No Clean Power Plan case set the high price, and the High Oil and Gas case set the low price.
The units in $ per short ton are transformed to $ per MMBtu of delivered coal fuel.
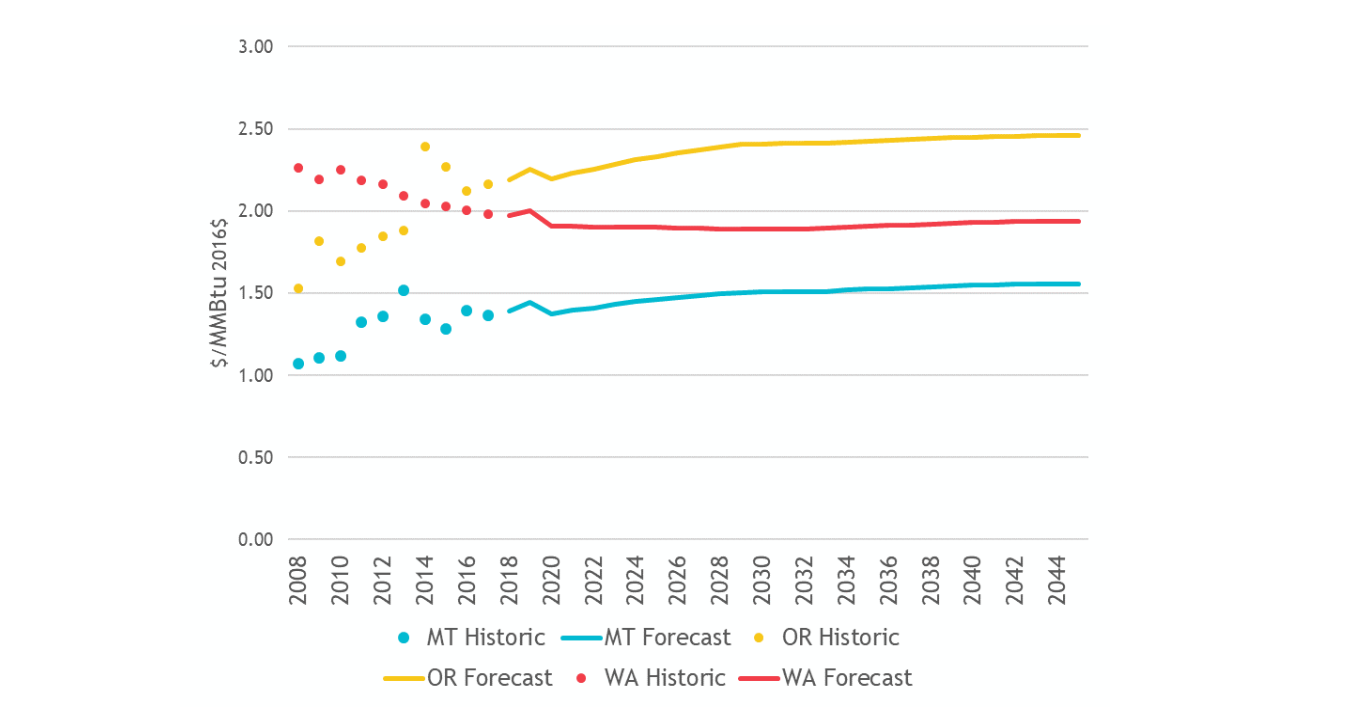
Delivered Coal Price History and Forecast