


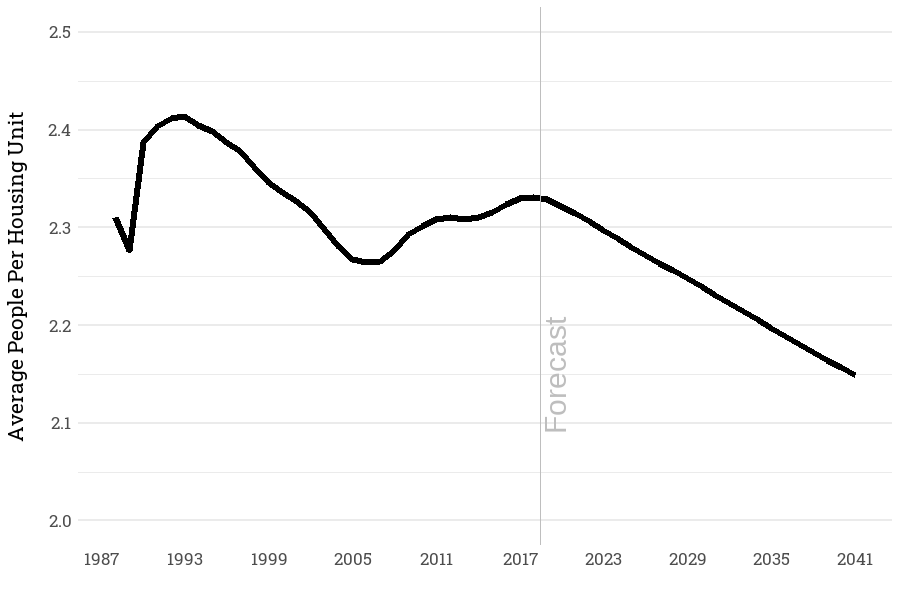
While the regional population has been increasing, the number of occupants per household has been declining. In 2017, the average household size was about 2.3 persons per household, and by 2040 it is expected to go down to 2.2 persons per household, resulting in the number of homes growing at a slightly faster rate than the population. Housing forecast data are available here.
Average People Per Housing Unit
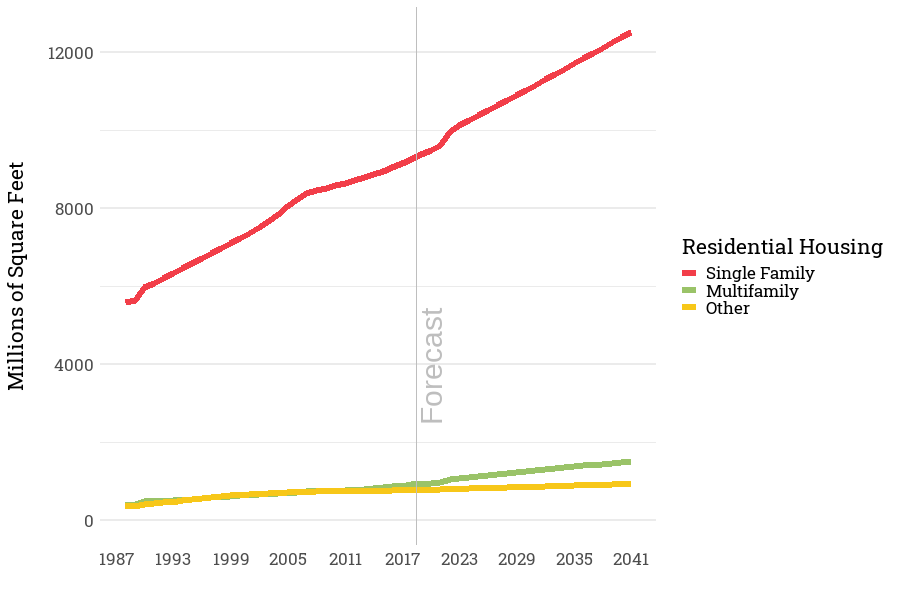
Between 1985 and 2012, the population grew at 1.5 percent per year and the number of single-family homes grew at 1.5 percent per year, with multifamily and manufactured homes (other family) growing at 2.2 to 2.3 percent per year, respectively.
Historic and future composition of Housing Stock in the Northwest
Housing Additions
The housing sub-sector that has not been growing as fast as it had been historically is manufactured housing. The factors determining demand for this type of housing are income, price of land, and the number of newlywed and low-income populations. Manufactured homes tend to be less-expensive housing options, so an increase in per capita income in the region has slowed demand for these homes. The price of manufactured housing has also increased, although significantly less than site-built homes.
Although manufactured housing typically represents about 10 percent of new homes in the region, they represent about 30 percent of electrically heated new homes. Recognizing this high percentage of electrically heated homes, the Manufactured Housing Acquisition Program was established in 1992. The incentive program, supported by the Council, the Bonneville Power Administration, state energy offices, electric utilities, and manufacturers, paid manufacturers the incremental cost to add efficiency measures to each new home. New manufactured homes peaked in 1995 after this program ended. For now, the stock of manufactured homes is projected to increase, although at a slower rate.
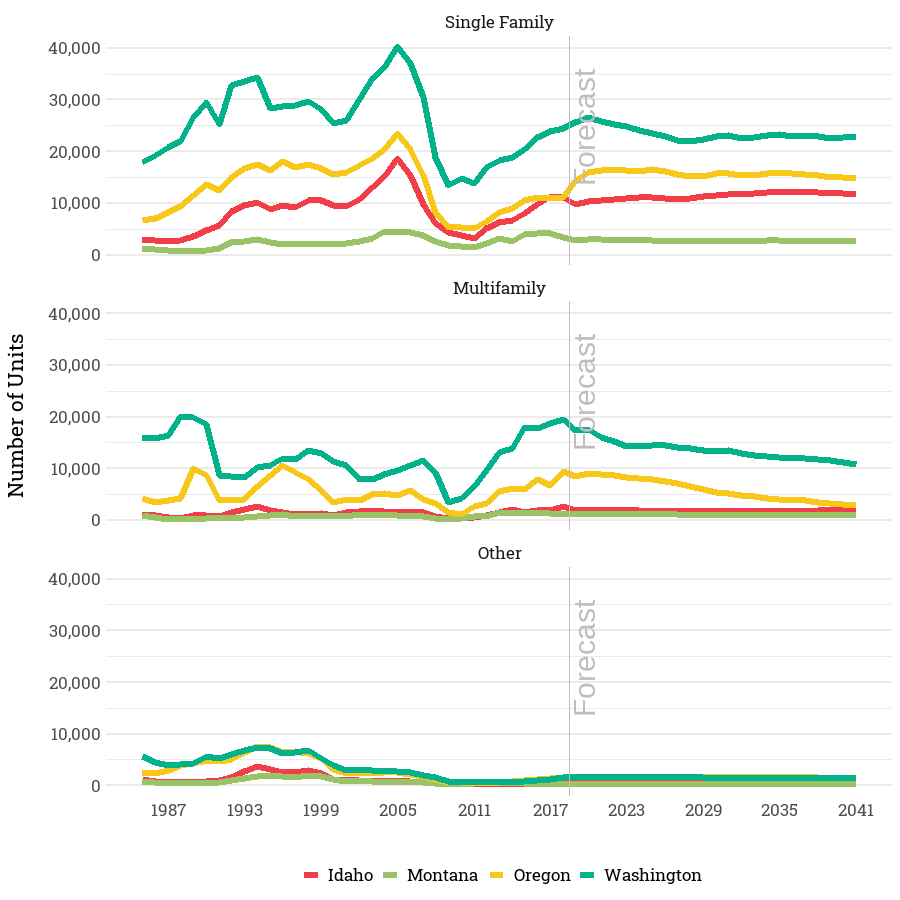
Figures below show the historical and forecast numbers of new single family, multifamily and manufactured/other homes) homes added to the stock each year by state and the regional total.
New Residential Additions
Size and composition of Homes
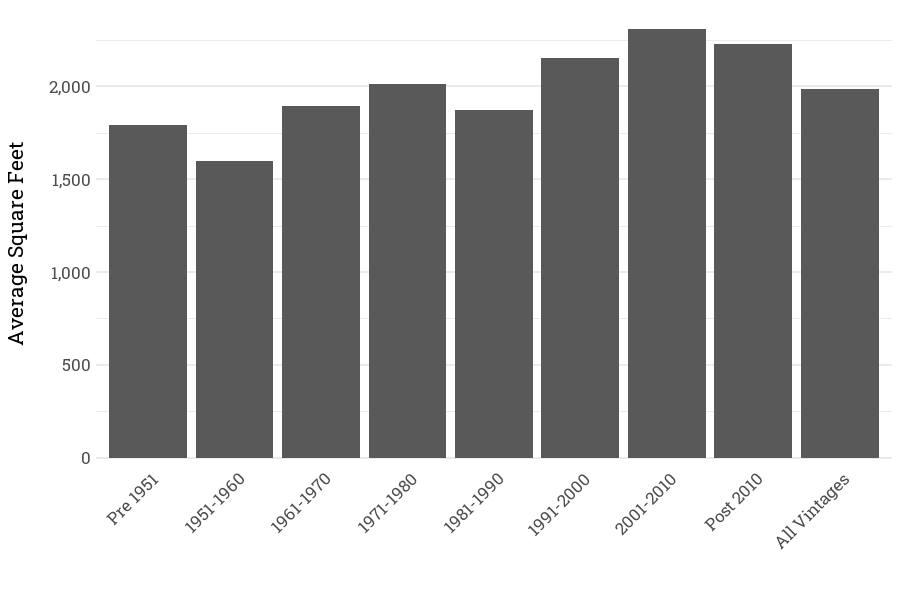
To forecast space heating and cooling requirement in residential sector, we use square footage of residential sector rather than number of residential units. Smaller home sizes reduce need for space conditioning and lowers demand for energy. Up to around 2010, the square footage of homes has been increasing. According to the U.S. Bureau of Census’s annual survey of new homes, the average single-family house, defined as a detached single-family home or a multi-plex unit of up to 4 units, completed in 2007 had 2,521 square feet, 801 more square feet than homes in 1977. Going back to the 1950s, the mean square footage of a new single-family home, as reported by latest Residential Building Stock Assessment () is about 1600 square feet. in subsequent decades single family size fluctuated but in general homes became larger. Because of economic recession starting in 2007 and slow-down in single family house construction, homes post 2010 are smaller than those built in 2001-2010. For homes build post 2010, sizes dropped by about 5%. We see a drop in the average size of single-family units from 2309 square feet per house to 2228 square feet per house. Similar reduction in size of multi-family homes can also be observed. Mean square footage for multifamily housing went down from 786 square feet for apartments built between 2000 and 2010 to 718 square feet for apartments built after 2010.
Average Size of Single-Family Homes by Build Vintage (RBSA 2016-2017)
For the forecast period we are planning to keep the size of new housing units at post 2010 levels.
Another factor that impacts demand for energy in the residential sector is composition of multi-family units. Multi-family housing is divided into three tiers. Low-rise, Medium-rise and high-rise units. Low rise buildings are typically up to three stories and built with lumber frame. Medium size building can reach 4-6 stories and can be combination brick and lumber. High-rise multifamily buildings are classified as seven plus floors and built with concrete and steel structure. We hold the assumption of the market share of the different types of buildings constant through the forecast period. These assumptions, along with the average square feet by building type are in the following table.
Forecast Market Share and Square Feet for Multifamily Buildings
| Multifamily Building Type | Market Share | Average Unit Square Feet |
| Low-Rise | 81.9% | 876 |
| Mid-Rise | 12.3% | 805 |
| High-Rise | 5.9% | 1167 |