Historical Carbon Dioxide Emissions
In the Pacific Northwest, the amount of annual carbon emitted from the generation of electricity is directly related to hydro conditions. Because the region’s power supply is dominated by hydropower, other resources – primarily fossil fuels – are dispatched around the hydro supply. Annual hydropower generation varies significantly from year to year depending on weather conditions and snowpack. In “good” or “above average” hydro years, fossil fuel resources are relied on and dispatched less; in “poor” or “below average” hydro years, fossil fuel resources are dispatched more.
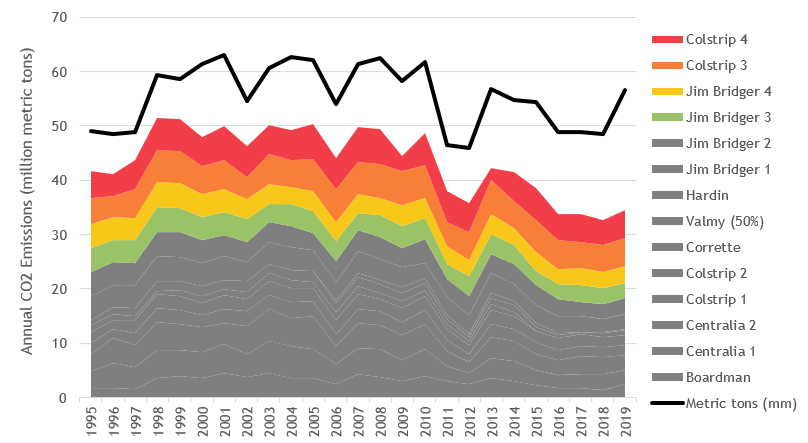
Due to the variability in annual hydro generation, and therefore fossil fuel generation, the region’s carbon emissions often bounce around from year to year. Over the past 25 years, annual carbon emissions from the generation of electricity – at the point-of-combustion – have averaged 55.5 million metric tons of CO2. In 2001, poor hydro conditions led to the second lowest Columbia River runoff since 1929. This was one of the promulgating factors that instigated the West Coast energy crisis, and it also resulted in a heavy reliance on fossil fuel resources, leading to a record high 63.3 mmt CO2 emissions in the region. Conversely, the lowest annual emissions over the past 25 years came in 2012, when hydro conditions were above average and fossil fuel resources emitted only about 46 MMt CO2. In 2019, due to particularly poor hydro conditions, emissions rose significantly to about 56 MMT CO2, a 16% increase from the relatively stable previous three years.
Annual Carbon Emissions from the Generation of Electricity in the PNW
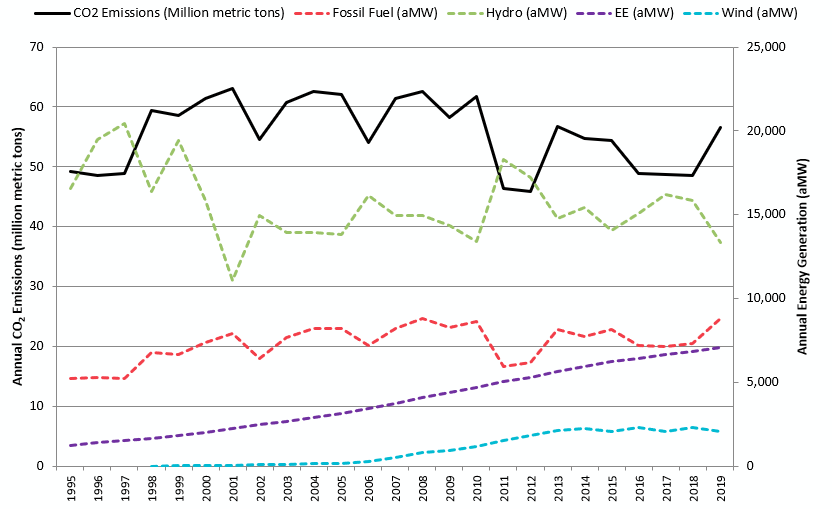
Overall, when looking at the emissions jumping around over the past quarter century, it can be difficult to determine overall trends. There are, however, indications that demonstrate emissions have been decreasing overall – and it has everything to do with fossil fuel dispatch.
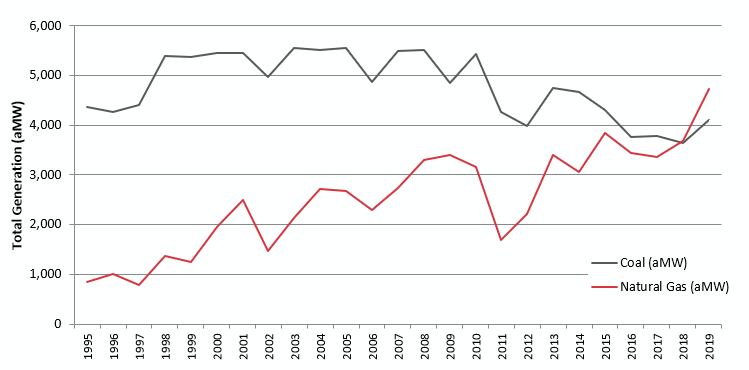
While fossil fuel generation largely dispatches based on hydro conditions and therefore experiences ups and downs from year to year, overall, fossil fuel generation has been steadily increasing. However, the dynamic between coal and natural gas dispatch is changing. On average, coal generation has been slowly declining in the past few years due to coal plant economics and low natural gas prices. Conversely, natural gas dispatch has been increasing thanks to the low fuel prices and increased gas resources on the system. The significance of this, in terms of emissions, is that natural gas emits about 40-50% less carbon dioxide than coal when combusted.
In 2018, natural gas generation surpassed coal generation on an annual basis for the first time. This disparity will continue to grow, especially as coal units in the region are scheduled to retire.
Historic Fossil Fuel Generation in the Region: Coal and Natural Gas
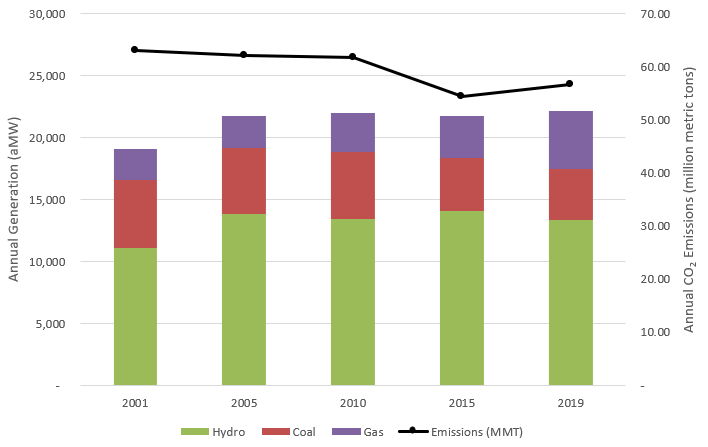
When comparing poor hydro years over the last two decades, we can chart fossil fuel generation and emissions and see a trend emerging. In particular, water conditions in 2005 and 2019 were very similar. Overall fossil fuel generation was greater in 2019 than in 2005, however the amount of coal generation was less and the amount of natural gas was more. Because natural gas is less carbon intensive, releasing roughly half the emissions of coal, the emissions from 2019 are 9% less than they were in 2005. This demonstrates the impact of the changes in fossil fuel dispatch on emissions, when hydro remains constant.
Comparison of Below Average Water Years
Contributing to the slow decline in carbon emissions are energy efficiency, which dampens load growth, and the rising fleet of renewable resources (primarily wind, but solar is beginning to make its mark), which helps lower the amount of carbon dioxide emitted per unit of energy.
As coal units begin to retire in the region (and nationwide), and existing natural gas generation continues to displace the dispatch of coal generation, emissions will begin to trend more deliberately downward in the coming years. From 1995 to 2019, on average, coal units in the region have accounted for about 80% of the region’s historic overall power plant CO2 emissions. However, that percentage is decreasing; in 2019, coal unit emissions contributed to about 60% of overall power plant CO2 emissions, with the remainder natural gas and a small percentage of petroleum emissions. The coal units that retired in 2020 and the units that are planned for retirement through 2028, emitted about 32% of overall power plant emissions in 2019 (as shown in the gray below). For more information on coal unit emissions, see existing system coal.
PNW Coal Units and Emissions
It is clear that with the retirement of these coal units, power plant emissions will decrease. However, the extent to which emissions decline depends entirely on replacement resources. The region may continue the trend of utilizing its existing gas fleet more or develop new more efficient natural gas plants. It is also possible that with the low cost of renewables and state renewable portfolio standards and state/city/utility clean energy policies in place, the region will see a significant increase in zero-carbon resources such as energy efficiency, renewables, and energy storage.
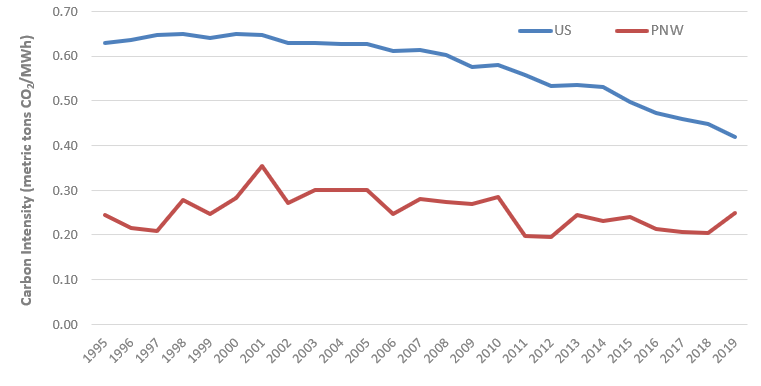
Carbon Intensity of the Region’s Power System
A useful metric to understanding power plant emissions in the context of overall power production is carbon intensity. The carbon intensity of electricity is the amount of carbon emitted per unit of energy generated. In the Pacific Northwest, where we have an abundant hydropower system that contributes to roughly 50% of our annual energy supply, the carbon intensity of the region’s power system ranges from 0.2 – 0.3 million metric tons of CO2 per megawatt hour generated (depending on the hydro year). Overall, the region’s carbon intensity is much lower than the carbon intensity of the United States power supply, whose energy portfolio looks a lot different than the region. While the carbon intensity of the United States is greater now, there is a clear decline in intensity since 2000 and even more evident over the last decade. In 2019, the carbon intensity of the United States’ power supply was 0.42 compared to the region’s 0.25, although of course the region experienced an increase in carbon intensity due to the poor hydro year.
Carbon Intensity: PNW vs. United States