Our reference forecast of natural gas prices is relatively smooth over time. There is a demand/production cycle wiggle in the price curve, as well as some seasonality due to the winter heating season, but mostly the forecast follows a linear, garden variety type path. However, in reality price series often resemble more of a rugged hiking trail, full of twists turns and surprises.
Our planning resource model – RPM – introduces uncertainty for gas prices. The reference forecast of prices is used as a guide for RPM to generate hundreds of potential futures, many with price volatility. So, before we get to that, a word on historic gas price volatility.
There are a number of factors that have created volatility in natural gas markets over the years.
- Natural disasters such as hurricanes that disrupt supply chains
- Infrastructure failures such as pipeline explosions or leaking storage facilities
- Unexpected spikes in gas demand due to shortages of other energy mediums
- Cases of oversupply can result in significant price drops
Henry Hub is a major gas distribution hub in Erath Louisiana which serves as a pricing point for gas futures on the New York Mercantile Exchange (NYMEX). Historically it serves as a proxy for national gas prices and is a good place to start when looking at gas price volatility.
Historic Monthly Natural Gas Prices at Henry Hub
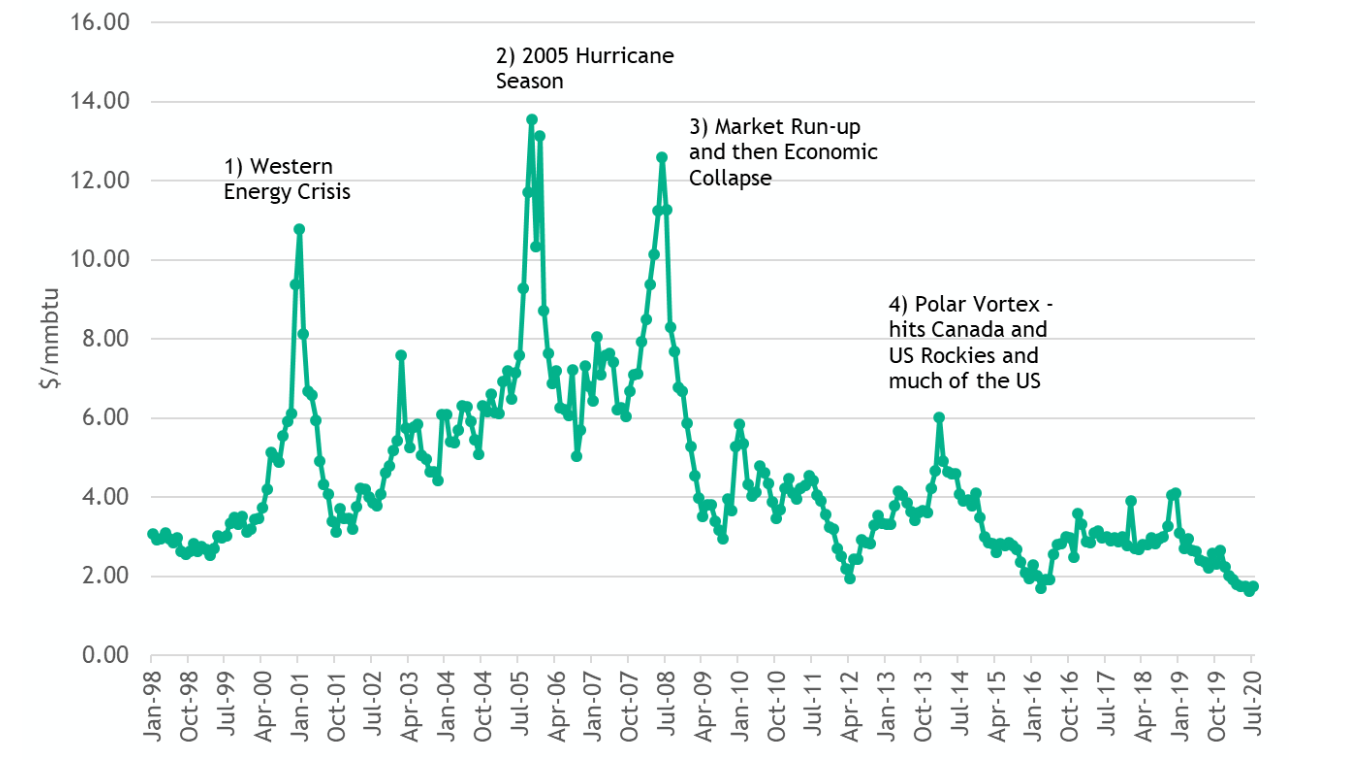
1. Western Energy Crisis
During the early 2000’s, hydropower conditions were dire in the West, especially California and the Northwest. This resulted in wild, extremely high wholesale electricity prices up and down the West Coast. Many factors converged during this time to create highly unstable gas prices – including demand spikes for gas fired power generation, market manipulation, and even an explosion on a major gas pipeline in the Southwest that supplies California.
2. 2005 Hurricane Season
Major hurricanes that strike the Gulf Coast of the US can cause intensive damage to gas infrastructure. The most active Atlantic hurricane season in recorded history occurred in 2005. Three major hurricanes hit the Gulf Coast region between late August and late October – Katrina, Rita, and Wilma. At that time, Gulf Coast gas comprised nearly 20% of the overall US gas production. The hurricanes took much of that production off-line for a period of time and gas prices jumped all across the US. Interestingly, the second most active Atlantic hurricane season hit the coast in 2017. Due to the recent surge in drilling technology – shale gas and fracking – the Gulf Coast only comprised around 4% of US production and this time the hurricane season had little impact on prices. See more information on hurricanes and gas.
3. 2008 Market
There was a big run-up of natural gas prices (and oil prices) in 2008, driven by concerns that demand would exceed supply, even though production was strong. These concerns proved to be unfounded; then the economy cratered and took gas prices down with it. Right around the corner was the fracking and shale gas bonanza, which has kept prices relatively low since.
4. 2014 Polar Vortex
The polar vortex of 2014 hit much of the US and Canada during the winter months. In the West especially, the cold snap hit in late winter. This frigid spell caused “freeze-off” supply disruptions to gas coming from Canada and the US Rockies. Demand for gas and electricity escalated and gas prices jumped across the US and especially the Northwest pricing hubs.
Historic Monthly Natural Gas Prices at Sumas
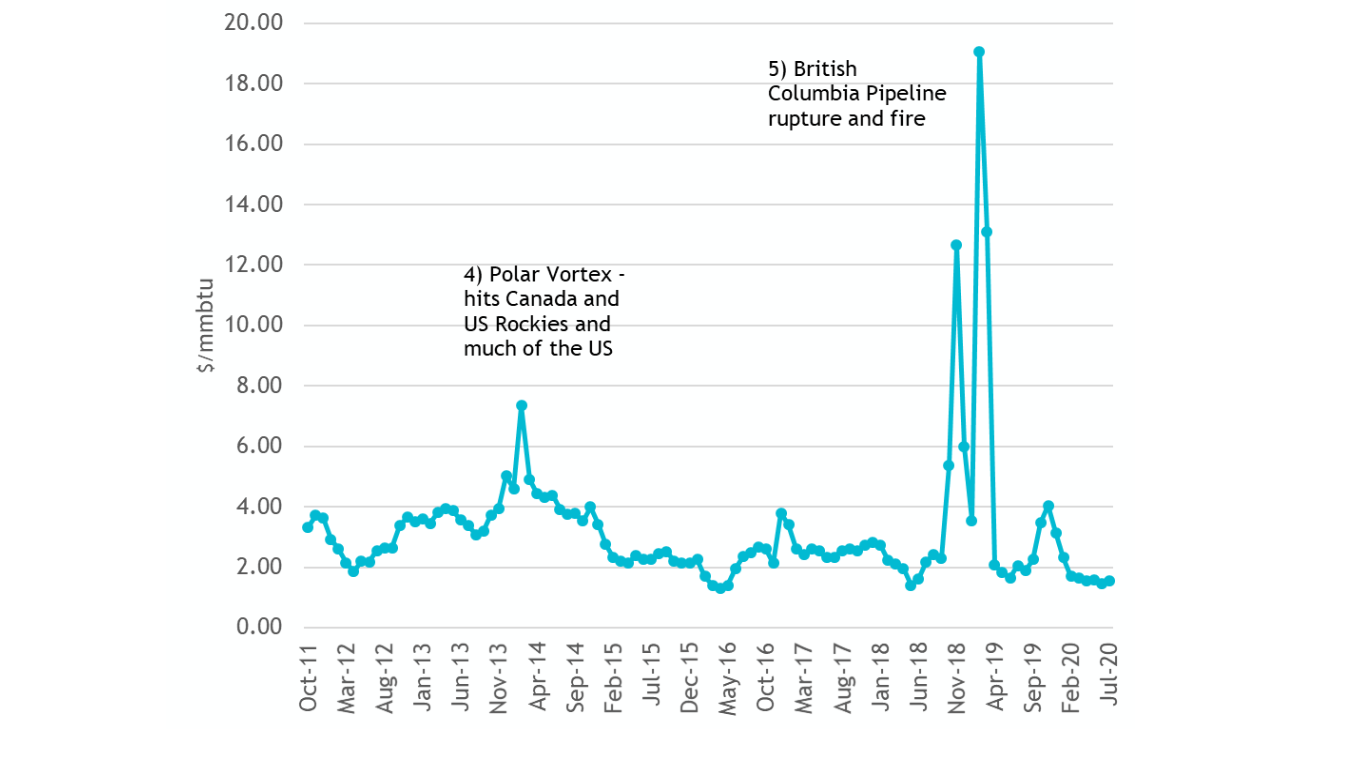
5. British Columbia pipeline rupture and fire
In October of 2018, there was a rupture and fire on the Enbridge Westcoast Energy pipeline in British Columbia. Gas flows were completely cut-off at the Sumas border to the US Northwest for a period of time. Please see section 1.1.4 British Columbia Pipeline Rupture and Fire for more information.
Historic Monthly Natural Gas Prices at AECO
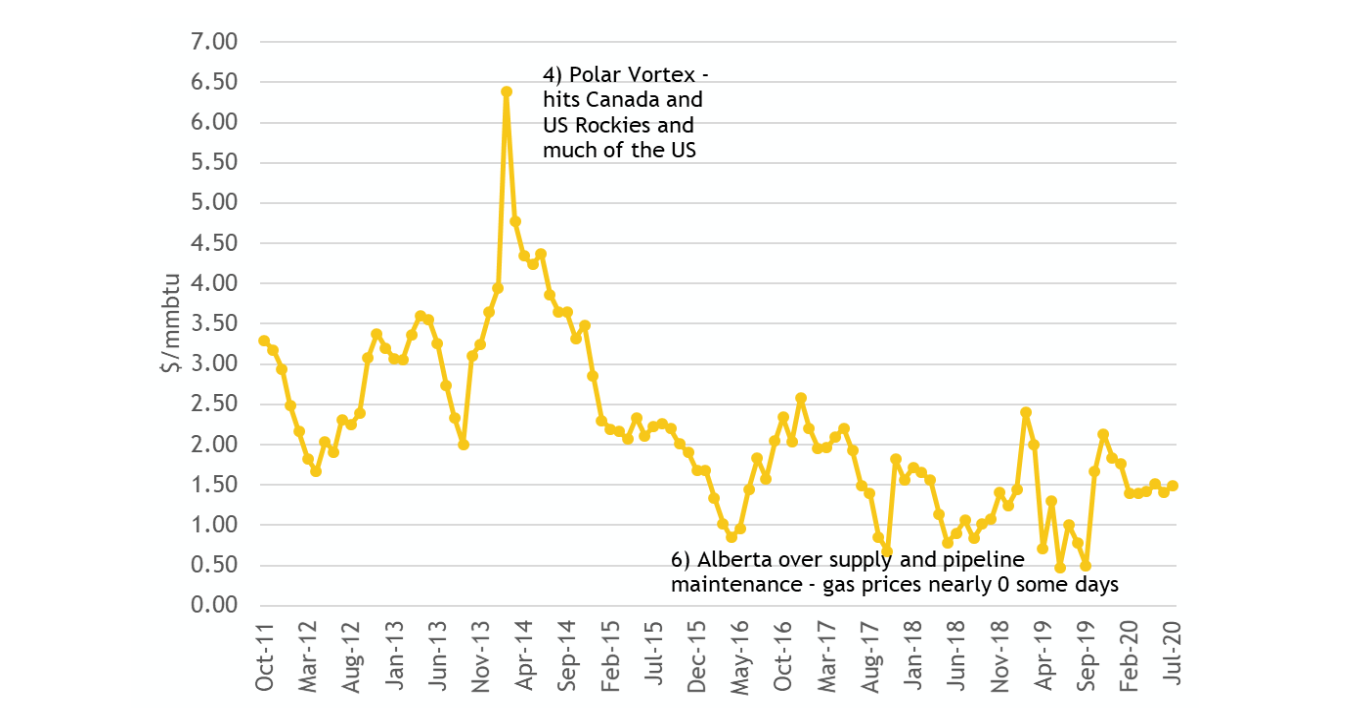
6. AECO prices near zero
Typically, we think of natural gas price volatility as upward price spikes, however it can also mean price drops. Alberta is an extremely productive natural gas province, supplying both Western and Eastern Canada, as well as the US Northwest, West and Midwest. Spot prices at AECO since 2016 have been very low, and at times daily prices have neared zero. This price volatility was driven by an abundance of gas, and pipeline maintenance issues resulting in stranded gas, and has been a boon for large gas consumers.
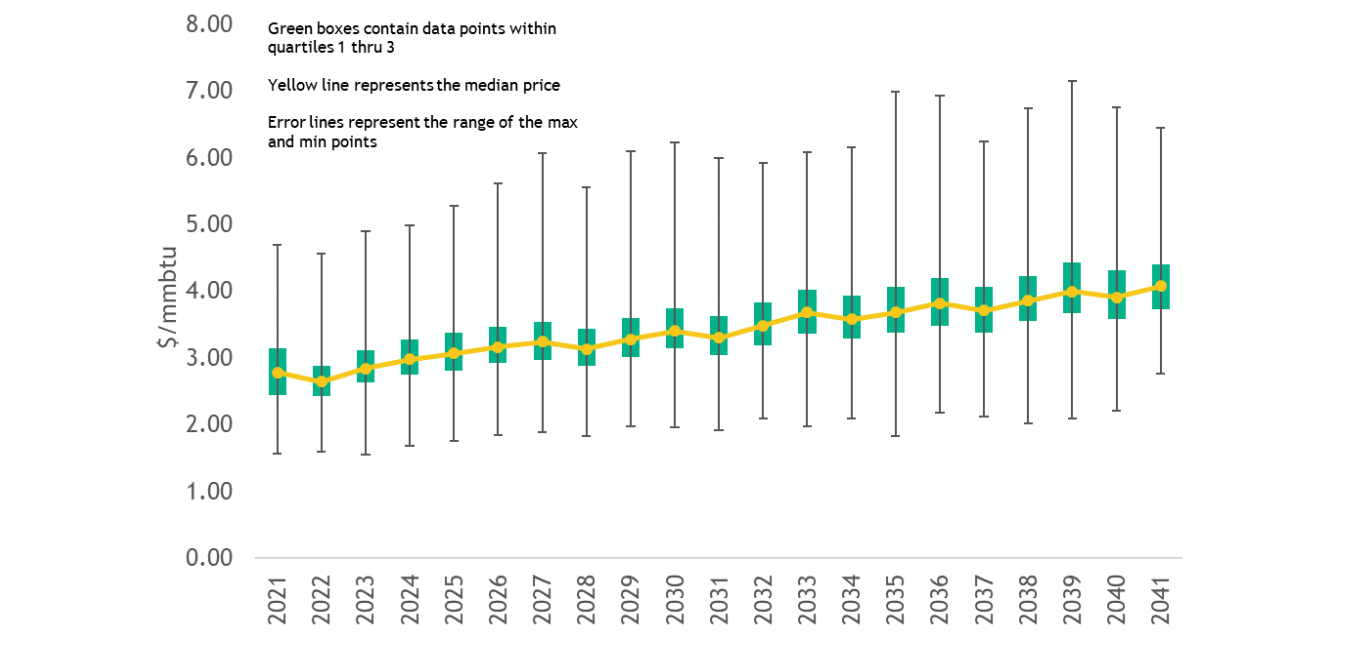
For our planning, we incorporate price volatility and risk in our resource planning model RPM. The reference price forecast covered in previous sections, including medium high and low, is input to RPM. The model uses parameters to introduce future volatility based on seasonality and jump factors. Jump factors can increase prices or decrease prices, by a magnitude, a duration, and a recovery period, similar to some of the historic price volatility we’ve outlined above.
The gas prices for 300 RPM futures are summarized statistically in the box plot below. Each price data point represents a calendar quarter. This is how we plan around future gas price volatility.
Gas Price Forecast Eastside – Futures from RPM