


Electric vehicles and buses are expected to gain significant market share from traditional petroleum-based transportation over the next twenty years. Therefore, it’s important to assess the magnitude and the temporal aspect of this new load that might be placed on the regional electric system. For the 2021 Power Plan, we have developed a series of charging or load profiles for light duty electric vehicles and electric buses in the region as part of our load forecast, and we have looked at how these profiles might change over time in order to see how they impact the load for the region.
The charging profile data for the electric vehicles and transit buses is available in the workbook - ChargingProfiles.xlsx
Electric Vehicles
This section details the load profile development for the electric vehicles that has been implemented in our long-term load forecast model. For this work, when we use the term electric vehicle (EV), we are referring to light duty cars, vans, and trucks with a drive train primarily powered by an onboard battery and electric motor. This includes both battery electric vehicles (BEV) and plug-in hybrid electric vehicles (PHEV).
The primary data set for our work was derived from Avista Corp’s Electric Vehicle Supply Equipment Pilot Program.[1] The utility ran a pilot program to install electric vehicle supply equipment (EVSE), study EV load patterns, and experiment with load management. The pilot involved installing a total of 439 EVSE charging ports in residences, workplaces, and multi-unit dwellings. The program also included 7 DC Fast Charging installations. Avista collected charging data by vehicle, location, and time. Our work was based on data from the interim report that was released in late 2018; the utility has since released a final report.
In our work to develop regional profiles, the first step involved using raw charging data from the pilot study to develop 6, 24-hour normalized electric vehicle load profiles:
- Residential only – weekday
- Residential only – weekend
- Residential & Workplace – weekday
- Residential & Workplace – weekend
- Public – Grocery
- Public – Retail
The category residential only – refers to electric vehicles that primarily charged at the home. If workplace charging is available, then the charging load may be split between home and workplace, this is referred to as residential & workplace.
Next, a method was developed to combine the six individual profiles to create a single year, 8760-hour normalized electric vehicle load profile. The time series profile is normalized to an annual energy use of 8760 MWh (1 aMW). An assumption on the amount that each of the six profiles contributes is required. This assumption may then be changed over time as charging opportunities and preferences evolve over the planning time horizon. In the near term, much of the vehicle charging load is expected to happen at the residence. As more charging stations are installed at workplaces and public shopping areas, the share of load at the home would decline. The profile captures the differences between weekday and weekend charging as well.
Four 8760-hour profiles were developed based on a set of four assumptions around charging location shares.
Percent of Charging Load for Electric Vehicle Profiles
| Charging Location | Profile 1 | Profile 2 | Profile 3 | Profile 4 |
| Residence Only | 70 | 60 | 45 | 25 |
| Residence & Workplace | 20 | 28 | 40 | 58 |
| Public | 10 | 12 | 15 | 17 |
The next figure shows the developed electric vehicle profile 1 for two full days, a weekday and weekend. The load profile peaks in the hour ending at 7 pm on a weekday.
Normalized Hourly Electric Vehicle Load Profile 1 Example

The final step was to overlay the electric vehicle load profiles with the region’s system load profile. This step provides important insights as to the importance of charging diversity and future utility load management. Much of the vehicle charging load occurs when commuters return home after work on weekdays, which coincides with the system load peak in the winter. By offering more workplace and public charging, the vehicle load could be more evenly distributed across the day resulting in a flatter load. Also, utility load management programs could move the residential evening charging to late night and early morning hours when the system load is much lower.
The next figure shows an example overlay of the four EV profiles with the regional system load. It assumes an annual overall vehicle load of 339 aMW. By moving more charging to sources outside the residence, the winter early evening EV peak load can be flattened.
Electric Vehicle 24-hour Profile and Winter Regional System Load
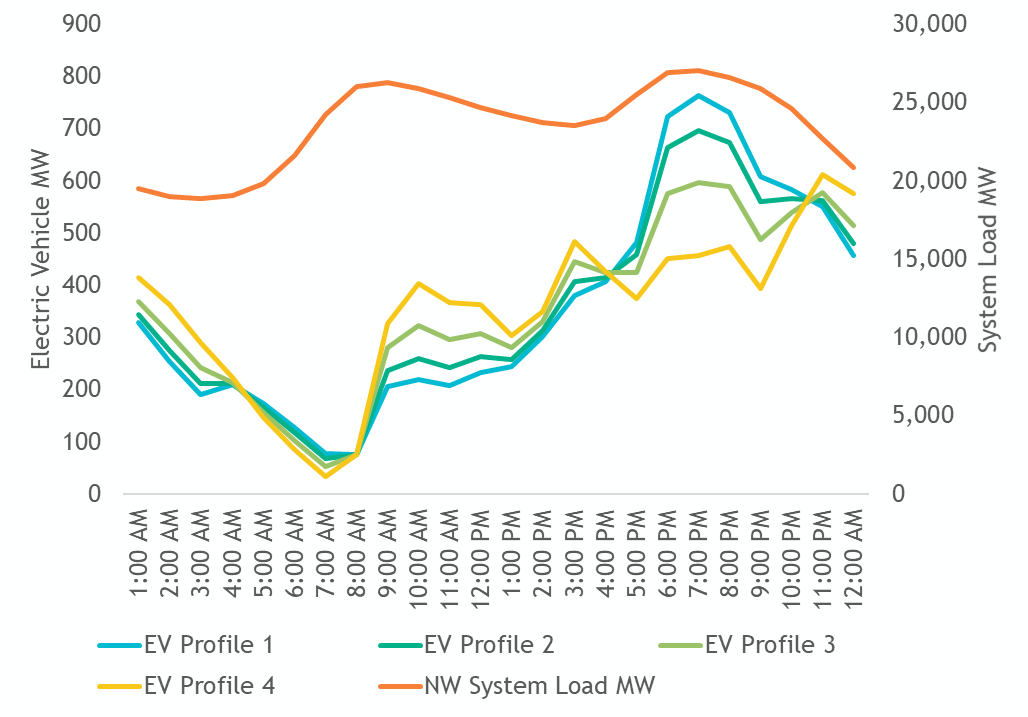
The vehicle load profile overlay with system load is also required to calculate the load scale factors used in our load forecasting model Energy2020. For the power plan load forecast, we assume that the vehicle load profile progresses from Profile 1 through Profile 4 over time as electric vehicles gain market share.
Electric Buses
In support of the modeling and forecasting work for transportation, an hourly load profile time series for electric transit buses was developed. The primary data set for this work was derived from a study[2] that the National Renewable Energy Lab did for the Santa Clara Valley Transit Authority. This study evaluated strategies to fully electrify a transit agency’s diesel bus fleet.
Two basic strategies for hourly fleet charging were evaluated in the study. The first is a charging operation where the buses charge immediately after arriving at the depot and the other is a smart charging strategy where charging is spread out through the day to reduce charging the batteries during peak load hours. As for the electric vehicles, the load profile was overlaid with the regional system load to calculate load scale factors. The next figure shows an example overlay of the two bus charging profiles.
Electric Transit Bus 24-hour Profile and Winter Regional System Load

Depending on specific needs, a smart charging type profile for a transit bus fleet could flatten system peaks in the morning and late afternoon and would make sense for bringing new load onto the system. For the power plan load forecast, we included this profile.
[1] https://www.myavista.com/energy-savings/green-options/electric-transportation
[2] Eichman, Josh, Andrew Kotz, Eric Miller, Ken Kelly, and Karen Ficenec. 2020. Fleet-Wide Electrification Impacts Assessment for the Valley Transportation Authority. Golden, CO: National Renewable Energy Laboratory. NREL/TP-5400-77547. https://www.nrel.gov/docs/fy21osti/77547.pdf