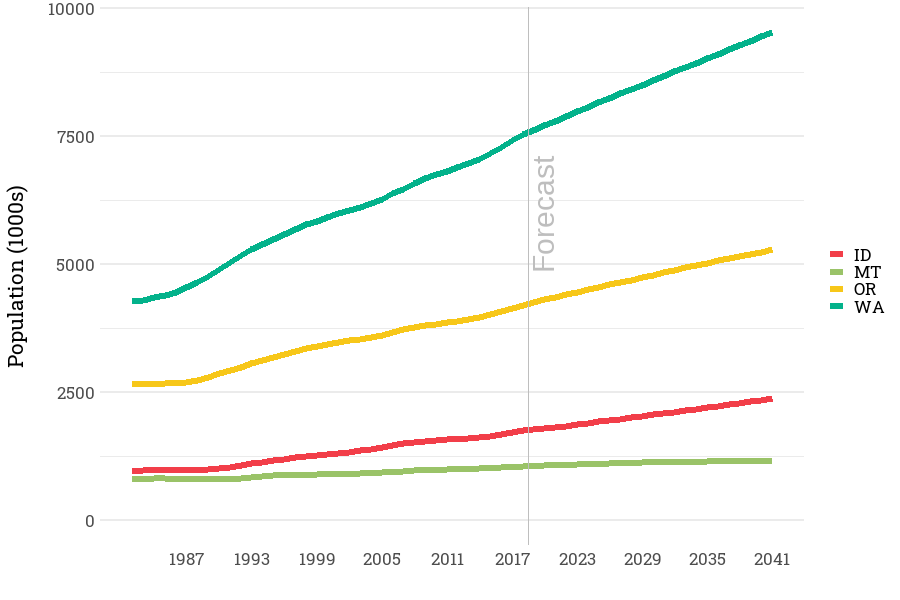
The region’s population increased from about 8.9 million in 1985 to about 15 million by 2020 and is projected to grow to over 18 million by 2040 at an annual rate of 0.7 percent between 2020 and 2040. Historic and forecast data are available here.
Regional Population by State
The Shifting Demographics of the Regional Population
The region’s population is changing and reflects demographic shifts seen throughout the United States. In 1985, 27 percent of the region’s population was younger than 19. This age group has been growing at about 1 percent per year, but it is forecast to grow more slowly for the next two decades, at around 0.7 percent annually. As a percentage of the total population, it is projected to represent about 19 percent of the population by 2040.
As indicated in the table below, it is forecast that by 2040 population increase in the region will be mostly from migration to the region from other states and countries.
Births, Deaths and Net Migration
| Births (1000s) | 1985 | 2017 | 2020 | 2040 | 2050 |
| Idaho | 17.6 | 23.1 | 24.1 | 28.3 | 30.4 |
| Montana | 13.5 | 12.5 | 12.7 | 12.7 | 12.8 |
| Oregon | 39.5 | 46.8 | 48.2 | 48.4 | 48.5 |
| Washington | 70.2 | 90.9 | 94.0 | 97.9 | 100.7 |
| Total | 140.8 | 173.2 | 179.0 | 187.3 | 192.4 |
| Deaths (1000s) | 1985 | 2017 | 2020 | 2040 | 2050 |
| Idaho | 7.1 | 12.7 | 13.4 | 20.6 | 23.5 |
| Montana | 6.7 | 9.7 | 9.8 | 13.2 | 13.7 |
| Oregon | 23.9 | 35.6 | 38.1 | 59.1 | 65.7 |
| Washington | 37.0 | 56.7 | 61.2 | 94.7 | 106.2 |
| Total | 74.7 | 114.7 | 122.5 | 187.6 | 209.2 |
| Net Migration (1000s) | 1985 | 2017 | 2020 | 2040 | 2050 |
| Idaho | -10.8 | 25.8 | 10.7 | 13.0 | 14.3 |
| Montana | -10.4 | 8.5 | 3.6 | 1.9 | 1.8 |
| Oregon | -7.1 | 45.6 | 39.5 | 32.5 | 33.9 |
| Washington | 21.3 | 87.6 | 51.0 | 48.4 | 55.1 |
| Total | -7.0 | 167.4 | 104.8 | 95.9 | 105.0 |
In terms of demographic components, the growth rate of 0 to 19 and 20 to 64-year-old age groups (representing the working age population) show a slowdown. The population cohort with increasing pace of growth is the 65 and older cohort. The working population cohort, 20 to 64- year old, has grown from about 5 million in 1985 to about 8 million in 2010, and is projected to grow to over 10 million by 2040. This age group has been growing at 1.5 percent per year, as shown in table 4, this growth rate is expected to be significantly reduced as more and more baby boomers retire. This demographic category plays a critical role in regional employment, demand for housing by type, major capital equipment, and goods and services.
Historic and Forecast of Population Growth by Cohort
| Age Cohorts | 1985-2017 | 2020-2040 |
| 0-19 | 0.9% | 0.4% |
| 20-64 | 1.5% | 0.5% |
| 65-84 | 2.3% | 1.6% |
| 85 and Older | 2.9% | 4.2% |
| Total Population | 1.6% | 0.9% |
The graph below shows the age composition of the Northwest’s population through time.
Composition of Regional Population by Cohort
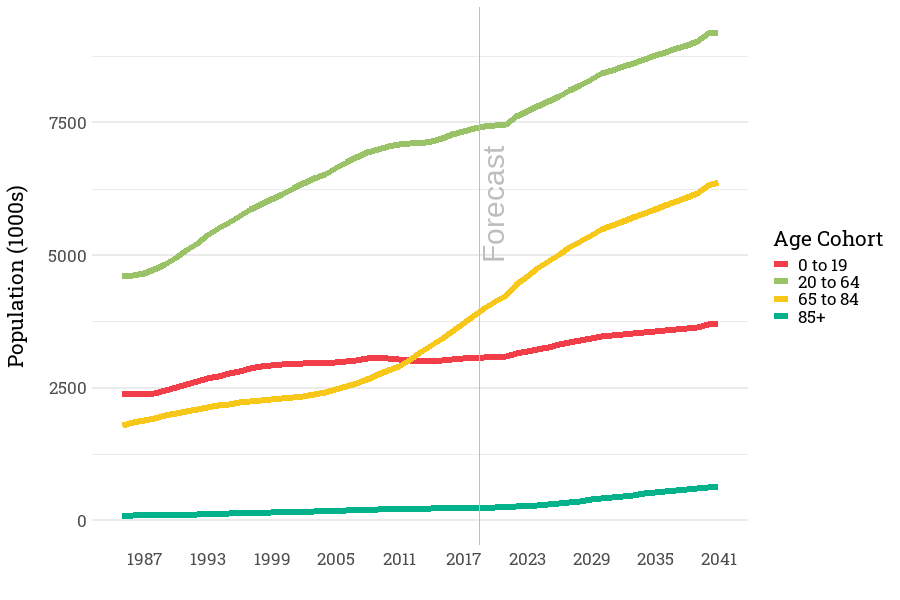
The fastest-growing population segment is people over 64, the “retirees.” They represented about 20 percent of the population in 1985, and by 2020 they are expected to represent about 28 percent of the region’s population.
The oldest age category of 85+ represented about 1% of regional population in 1985, see table below. By 2020 this population category is expected to account for 2 percent of population and by 2040, 3 percent of population, or over 500,000 people. This trend has affected the commercial sector in many ways, and the increase in the number of businesses catering to elders is one example. In 2005, the Bureau of Labor Statistics and county business patterns show there were over 3,200 businesses in the region offering elder care services. Such businesses had more than 100,000 employees and occupied about 178 million square feet of space by 2015. If the current trends continue, by 2035 an additional 54 million square feet of space would be needed for elder care. The demand from this business is tracked in the commercial section of the model.
Composition of Regional Population
Age Cohorts as Percent of Total Population
| 1985 | 2017 | 2020 | 2040 | 2050 | |
| 0-19 | 27% | 21% | 21% | 19% | 18% |
| 20-64 | 52% | 51% | 51% | 46% | 45% |
| 65-84 | 20% | 26% | 26% | 32% | 33% |
| 85 and older | 1% | 2% | 2% | 3% | 4% |
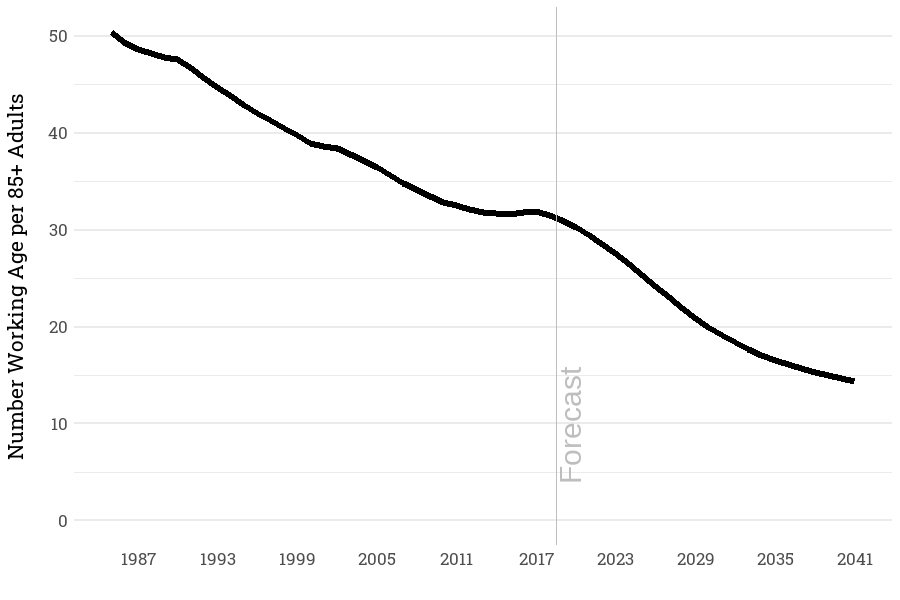
The number of working age population supporting 85+ population is expected to decrease significantly. From 55 in 1985 to 15 in 2040, see the graph below.
Number of Working age population per 85+ population