- 4-A. Resources Added Since 1991
- 4-B. The Hydroelectric System
- 4-C. Other Generating Resources
- Coal-fired Power Plants
- Nuclear Power Plants
- Natural Gas-Fired Combined-Cycle Power Plants
- Industrial Cogeneration
- Other Renewable Resource Projects
- Other Projects
- 4-D. Conservation
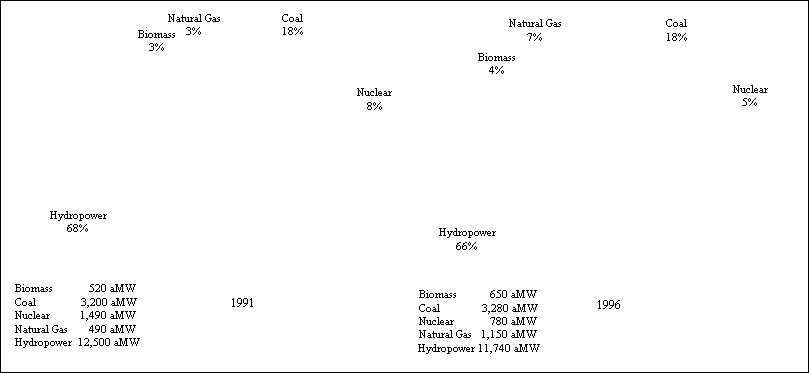
The makeup of the Northwest's electric power system continues to evolve in response to a variety of forces and trends. The existing system and its capability are described in detail in Appendix A. Figure 4-1 shows the composition of generating resources in the region. Generating resources in the Northwest amount to more than 17,000 average megawatts.
The majority of regional generation, about 66 percent, comes from the hydroelectric system. Coal resources are the next largest component, representing 18 percent of all generating resources, followed by natural gas, nuclear and biomass resources.
4-A. Resources Added Since 1991
Beginning in the late 1980s, increased economic activity and accompanying electrical load growth initiated a period of active resource acquisition in the Northwest. For most of this period, utilities relied on competitive bidding, conservation activities and the development of utility-owned projects for meeting growing resource needs. Competitive bidding appeared well-suited both to secure low-cost generating resources and to account for environmental externalities, resource diversity objectives and other non-market societal objectives.
Some conservation also was acquired through competitive bidding, but utility programs, building-and appliance-efficiency standards, market transformation initiatives and other efforts were generally more effective for securing conservation. Since 1980, the Northwest has secured more than 1,200 megawatts of electricity savings. About 520 megawatts of that total have been saved since 1991.
Figure 4-1. Generating Resources of the Northwest Power System (Firm Energy Basis)
[graphic doesn't display correctly]
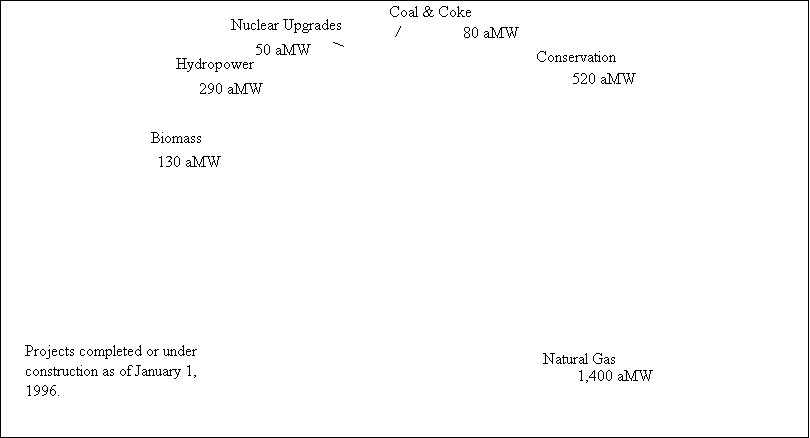
Conservation and generating projects totaling about 2,470 average megawatts of energy were secured during the 1991 through 1995 period (Figure 4-2). Declining natural gas price forecasts, improving combustion turbine technology, declining capital costs, and relative ease and speed of construction continued to improve the attractiveness of gas-fired combined-cycle power plants. Natural gas-fired projects providing about 1,400 average megawatts of energy were acquired during this period, comprising about 57 percent of total acquisitions on an energy basis. About 520 average megawatts of conservation were acquired since 1991, representing about 21 percent of total new acquisitions. Renewable energy projects, primarily hydroelectric and projects using biomass residue fuels, provided about 420 megawatts of resources that were committed to during this period. The balance of acquisitions include upgrades to existing thermal projects and projects using coal or petroleum coke.
Natural gas resources have increased the most in the last five years, from 3 percent in 1991 to 7 percent in 1996, primarily due to the fact that natural gas is among the least expensive and most flexible new generating options available. Although concerns have been expressed about what some have termed an "over-reliance" on gas-fired new generating resources, overall resource diversity is probably greater than it ever has been because of the new gas-fired resources. Furthermore, because of the increasing importance of the Western wholesale electricity market, resource diversity in the Pacific Northwest will probably be of lesser significance than West Coast resource diversity. The Northwest and California systems combined provide significant resource diversity.
Figure 4-2. Resource Acquisitions: 1991 through 1995 (average megawatts)
[Projects completed during the 1991 through 1995 period, or under construction at the close of 1995. Planned projects for which construction has not commenced are not included in Figure 4-2. Graphic doesn't display correctly.]
Although regional electrical load growth continues, there have been no solicitations for new power plants within the past year. Declining natural gas prices and an increasingly active wholesale market have made the surplus of capacity on the interconnected Western system less expensive, more evident and more accessible. Utilities and large consumers are purchasing inexpensive wholesale power produced by existing plants on the Western system rather than building or purchasing the output of new power generating facilities. Low-price wholesale power has even led to suspension of construction for several projects, most notably the 248-megawatt Tenaska Washington II gas-fired combined-cycle plant.
Conservation activities, too, have declined. Conservation acquisitions in 1996 are expected to amount to only 70 average megawatts, about 60 percent of the region's 1995 acquisitions.
The Northwest power system has also lost resources over the last five years, including:
- Reduction of the operational flexibility and generating capability of the Columbia River Basin hydroelectric system as a result of changes in the pattern of reservoir storage and water releases intended to improve the survival of anadromous and resident fish. This has resulted in an estimated reduction of 850 average megawatts of firm energy capability;
- Closure of the Trojan nuclear power plant in the face of a requirement for significant additional capital investment to remedy problems encountered at the plant. This has meant the loss of 725 average megawatts of energy.
The changes in Northwest electricity resources since 1991 have probably resulted in a net increase in the emissions of carbon dioxide, a gas implicated in global warming. Factors that would increase carbon dioxide production include the closing of the Trojan nuclear power plant and the loss of hydroelectric generation due to spilling water to enhance fish passage.
Fish mitigation activities that shift power production seasonally or from firm to nonfirm periods do not necessarily increase carbon dioxide production. Power produced during fish flow periods, for example, may displace carbon-dioxide emitting fossil-fuel plants in the Southwest. But, foregone hydropower during other seasons and the lost power from Trojan will be replaced by higher carbon-dioxide emitting generation, except to the extent the losses are replaced by conservation, hydroelectricity or biomass generation. The net effect of emissions from new gas-fired combustion turbines is difficult to ascertain because the turbines may displace the operation of power plants that emit even more carbons, such as coal-fired plants.
The remainder of this chapter describes the major electricity resources in use in the Northwest.
4-B. The Hydroelectric System
The Northwest's hydroelectric system, although reduced in its capability and flexibility, is still an adaptable and low-cost resource. It produces more than two-thirds of the electricity in the region. In the near term, the region's advantageous position with respect to gas markets and the relative flexibility of gas-fired generation are important complements to the hydroelectric system. The flexibility of the hydroelectric system may also prove valuable when intermittent renewable resources are integrated into the power system. The challenge is to maintain and enhance the value of the hydroelectric system, while at the same time providing for non-power uses such as flood control, irrigation, recreation, transportation and fish and wildlife.
The hydroelectric system differs from thermal generating resources in that its instantaneous generating capacity far exceeds the amount of energy it can produce over the course of a year. This is because reservoirs cannot store enough water to keep turbines running at full capacity all year. Consequently, Northwest utilities have traditionally focused on meeting annual average energy needs as opposed to daily peak electricity demands.
The Columbia River hydroelectric system's sustained peaking capacity [Sustained peaking capacity is the power system's ability to meet electricity demands during the peak hours of the day for a sustained period of time, usually the five working days of the week. The peak demand period per workday typically lasts 10 hours.] is about 25,000 megawatts, [1995 Pacific Northwest Loads and Resources Study, Bonneville Power Administration " The White Book ," December 1995.] but limitations on the storage capacity of the system result in significant variations in the system's energy output from year to year, depending on annual rainfall and snowpack accumulation. In the driest years, the hydroelectric system produces only about 11,700 average megawatts of energy. Utility planners can expect at least that much energy in any given year, so it is considered guaranteed or "firm" energy. In the wettest years, the hydroelectric system produces about 20,000 average megawatts. In average water years, the dams generate approximately 16,500 average megawatts.
Generation in excess of what can be guaranteed is commonly referred to as "nonfirm" or "secondary" energy. Nonfirm energy is sold on the spot market or under short-term contracts at lower prices than is obtained for firm energy. It is used to serve interruptible loads or to displace more expensive resources both in and out of the region.
Accommodating Fish and Power
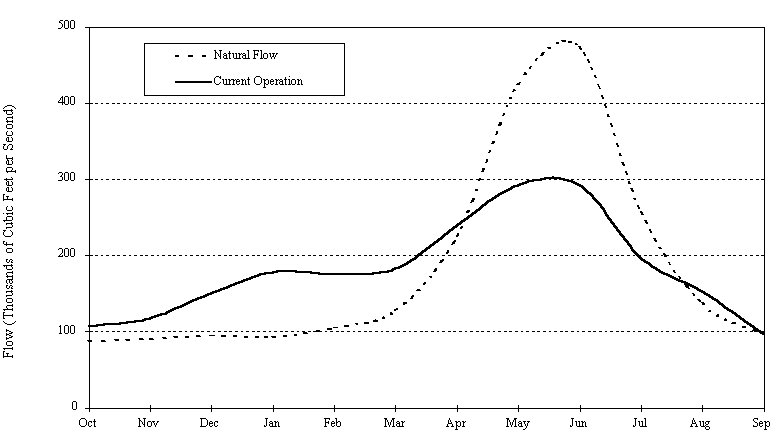
The Columbia River historically supported one of the world's largest salmon populations. Over the years, however, the number of salmon and steelhead in the river has decreased dramatically. Several Columbia River Basin salmon species are now extinct. Others have declined nearly to the point of extinction. Hydroelectric development has been an important factor in that decline. The natural flow of the Columbia River peaks in spring and early summer, when the snowpacks melt. Energy production from the hydroelectric system depends on this flow of water. If reservoirs were not available to store water for later use, the energy derived from the hydroelectric system would rise and fall with the natural flow of the river. This would not be a very reliable or valuable source of electricity because peak river flows (in spring) do not coincide with peak electricity demands (in winter). Figure 4-3 illustrates the monthly pattern of river flows under natural conditions, before hydroelectric development, and under current conditions, which include changes in dam operations to protect salmon and other fish and wildlife. [Natural flow data was obtained from the Bonneville Power Administration's document "Seasonal Volumes and Statistics, Columbia River Basin 1928-1989," July 1993.]
By building dams to hold back some of the spring runoff for use the following winter, the output from the hydroelectric system can better meet the seasonal fluctuations in electricity use in the Northwest. Although this shifting of river flows makes the hydroelectric system a more valuable source of power, it also creates a more hostile environment for migrating juvenile salmon. Inundation of spawning and rearing habitat and hazards created at the dams themselves have also affected salmon production and survival.
But the dams were not built for electricity alone. They also help control flooding, provide water for irrigation and industrial use, improve navigation on the river and expand recreational opportunities in the Pacific Northwest. All these uses can have adverse impacts on both fish and power. In addition, salmon populations have been affected by commercial and sport fishing, ocean conditions, hatcheries and hatchery-bred fish, habitat destruction caused by logging, grazing and other developments, and a host of other factors that are not well understood. The Council's Columbia River Basin Fish and Wildlife Program addresses all of these impacts.
Because the hydroelectric system is one of the important factors affecting fish and wildlife survival, its operation has been modified since the early 1980s in an attempt to create a better balance between the generation of electricity and protection for fish and wildlife. As at-risk fish stocks have weakened, further constraints on the operation of the hydroelectric system have been implemented. The effect of most of these changes is to shift the release of water back toward the spring and early summer to more closely approximate the natural flows of the river. By releasing less water from headwater storage projects during the winter months, more is available for later release during the spring smolt migration period.
Figure 4-3. Average River Flows at The Dalles Dam
However, this action reduces the amount of energy available from the hydroelectric system during the winter months and forces the production of energy during a time when it is not in great demand. This effectively reduces the firm energy generating capability of the hydroelectric system. During dry years, lost winter energy must be replaced if all firm energy demands are to be served.
The Council's 1982 Fish and Wildlife Program included measures that reduced the firm energy generating capability of the hydroelectric system by an estimated 300 average megawatts. In addition, water laden with juvenile salmon was spilled over dams to divert the young fish from the turbines. The spills further reduced the firm energy generating capability of the system by about 50 average megawatts. This was the river operation that was used as the basis for resource analysis in the 1991 Power Plan.
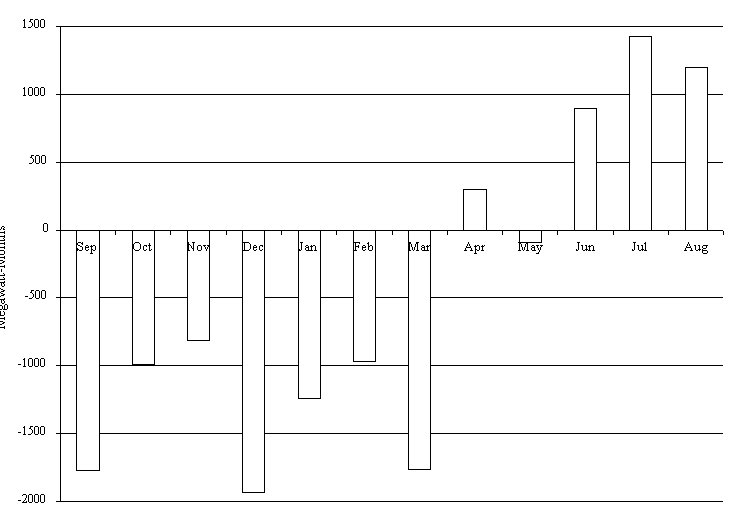
Since 1991, more fish and wildlife protection measures have been implemented. Changes in river operations since 1991, including those enacted by the National Marine Fisheries Service to protect endangered Snake River salmon, have reduced the firm generating capability by an additional estimated 850 average megawatts (about a 7-percent loss). Consequently, the total reduction in firm energy generating capability of the hydroelectric system since the Council adopted its first fish and wildlife program amounts to approximately 1,200 average megawatts, representing a 10-percent loss. Figure 4-4 illustrates the average monthly change in hydroelectric generation due to fish and wildlife measures.
Under current operations, the hydroelectric system produces an average of nearly 10,000 megawatt-months less energy in the fall and winter compared to 1991 operations. About 4,000 megawatt-months are shifted into spring and summer months, and nearly 6,000 megawatt-months of energy are spilled or lost due to efficiency losses. [Efficiency losses occur when power is generated at lower reservoir elevations. Reservoirs are operated at lower elevations in order to increase the velocity of the river.]
Figure 4-4. Changes in Hydroelectric Generation by Month Since 1991
In some fall or winter months, it can be necessary to purchase electricity from outside the region to provide adequate water for spring flow augmentation and serve firm Northwest electricity demands. The total cost to the power system of operations to protect fish and wildlife are calculated by combining power purchase costs, lost revenues due to reductions in firm power production and changes in the amount and value of nonfirm power.
A more constrained operation of the mainstem Columbia and Snake river reservoirs also results in capacity losses. For example, prior to the 1980s, the elevation of the lower Snake run-of-river projects varied five feet or more on a daily basis. These dams are drafted during the peak-demand hours of the day and refilled during the light-load hours of the night. If these reservoirs are now constrained to fluctuate only about a foot to benefit various fish populations, they lose much of their ability to meet daily peak-demand swings. This limited operation may also result in the loss of nonfirm energy. If reservoirs are not allowed to fill completely during the lightly loaded hours of the night due to elevation limitations, some water may have to be spilled, resulting in lost generation.
4-C. Other Generating Resources
In addition to the hydroelectric system, other sources of bulk electric power in the Northwest include large coal-fired power plants, the Washington Public Power Supply System's WNP-2, and simple-cycle and combined-cycle natural gas combustion turbines. Electricity is also produced by industrial cogeneration plants, small biomass plants and numerous small hydroelectric projects. A table and map of individual Northwest power generating projects is provided in Appendix A.
Coal-fired Power Plants
Following the development of the Columbia River hydroelectric system, coal and nuclear power were viewed as the most economical new sources of electricity. Abundant supplies of low-cost, low-sulfur coal are available from the Rocky Mountain states and western Canada fields, and more limited supplies of lesser quality from Washington fields. Accordingly, between 1968 and 1986, 14 coal-fired power units at six sites were brought into service by Northwest utilities. These large plants can serve about 6,660 megawatts of winter peak load, of which about 3,990 megawatts are currently dedicated to Northwest loads. These plants can produce about 5,520 average megawatts of energy, of which 3,395 average megawatts are dedicated to Northwest loads. Because the minemouth units have low operating costs, they are operated under nearly all conditions. Units that use coal supplied by rail are more expensive to operate and currently compete with natural gas combined-cycle power plants and off-peak power from Southwestern plants.
Nuclear Power Plants
Concurrent with the development of the region's large coal-fired power plants, regional utilities initiated construction of 10 nuclear plants. Only two, Trojan, in Oregon, and WNP-2, in Washington, were eventually completed. [Trojan was completed in 1976 and WNP-2 in 1984. The Hanford Generating Project operated on steam from the N-reactor, a Hanford Production Reactor, until 1988, when it was shut down upon termination of plutonium production operations at Hanford. ] Two partially completed plants, WNP-1 and WNP-3, were preserved for many years for completion, if needed. With the continuing decline in gas prices, they have been terminated. Nuclear plant operating costs have generally been higher and plant availabilities lower than anticipated when these plants were ordered.
Trojan was permanently shut down in 1993, when it was concluded that the cost of a needed steam generator replacement would result in production costs barely competitive with the cost of power from new resources. WNP-2, upgraded from its original peak capacity, can now serve about 1,170 megawatts of winter peak load. The plant produced 822 average megawatts of energy in Bonneville's 1995 Fiscal Year and was available to produce 890 average megawatts. WNP-2 currently has operating costs that are above market prices. The Washington Public Power Supply System, owner and operator of the plant, has established aggressive cost reduction targets. However, continued low market prices pose a risk for the continued operation of WNP-2.
Natural Gas-Fired Combined-Cycle Power Plants
The abundant gas resources of Western Canada and the Rocky Mountain states are accessible to the Northwest by two interstate pipelines. Declining natural gas prices and improving combustion turbine technology have made gas-fired combined-cycle power plants the least-costly new resource for bulk power production. Most of these projects consist of one or two combined-cycle combustion turbine units, and many serve modest cogeneration loads.
Six gas-fired combined-cycle projects were in service in the Northwest by the end of 1995. Two additional projects are under construction. [Combined-cycle power plants in operation in the Northwest by the end of 1995 include Beaver, March Point, Sumas Energy, Tenaska Washington I, Encogen and Coyote Springs 1. Hermiston Generating Project is scheduled for service in 1996. Construction of the River Road project commenced in February 1996. Additional information regarding these projects is supplied in Appendix A.] Projects in service or under construction at the end of 1995 will serve about 1,900 megawatts of winter peak load and can produce about 1,460 average megawatts of energy. Some of these projects are owned by independent developers and others by utilities.
Additional projects totaling about 930 megawatts of capacity are currently permitted for construction. One of these projects is partially constructed, but further construction has been suspended. Construction on the other projects is not scheduled. License applications for additional projects of about 2,700 megawatts total capacity are being considered by licensing agencies. Developers have indicated that they will apply for licenses for several additional projects.
Three of the projects for which licenses are being sought are part of Bonneville's Resource Contingency Program. This program responded to the 1991 Power plan's call for obtaining "options" on the development of 2,450 average megawatts of new generating resources. By taking projects through the siting and licensing process, but delaying the actual construction until the market for the power is clear, it is possible to reduce the risk of investing in generation in advance of need. The options concept was devised primarily for long lead time resources and a regulated generation market. The value of options with resources that have much shorter lead times and a competitive generation market may not be as great as it was under those earlier conditions. On the other hand, siting and licensing some projects in advance of market demand may continue to provide some benefits for both prospective developers and the public.
Industrial Cogeneration
Industrial cogeneration in the forest products industry has long been a component of Northwest electric power generation. These plants include chemical recovery boilers in the pulp and paper industry, and power boilers fired by wood residues, fuel oil and gas in both the pulp and paper and lumber and wood products sectors. More recently, gas-fired combustion turbines have been installed as industrial cogeneration units.
Because of the many mill closures of recent years, and because many industrial cogeneration plants do not sell power offsite or generate power only when fuel costs are favorable, a precise inventory of operating industrial cogeneration plants is difficult to obtain. There are estimated to be approximately 70 plants in operation. These total in excess of 770 megawatts of capacity and are capable of producing in excess of 600 average megawatts of energy. Most industrial cogeneration plants in the Northwest are owned by the host facility, but recently several have been developed by utilities.
Other Renewable Resource Projects
Biomass: Many of the cogeneration plants described above use wood residues, spent pulping liquor and other biomass fuels. The number and diversity of small biomass plants has expanded in recent years and now includes plants using pulping liquor, wood residues, landfill gas, municipal solid waste and wastewater treatment plant gas.
Hydroelectric: Many hydroelectric projects have been developed on coastal streams, tributaries of Puget Sound and tributaries of the Columbia River. Most suitable large-scale sites have been developed, and recent development has focused on headwater diversion projects, projects on irrigation systems and upgrades of older hydroelectric projects.
Geothermal: There has been no commercial development of the potentially abundant geothermal resources of the Northwest for electric power generation. [Small demonstration projects operated briefly at Raft River, Idaho, and Lakeview, Oregon. Numerous direct applications of geothermal energy for space or process heating are found in the region.] Pilot projects are being developed at Newberry Volcano, in Oregon, and Glass Mountain, in Northern California, to explore the cost and feasibility of using these resources for power generation. Though it is unlikely that these projects will be competitive with the near-term wholesale power market, geothermal may prove to be an important source of renewable power in the long term.
Wind: Four commercial-scale wind projects are being developed to explore the cost and feasibility of using this resource for power generation in the Northwest. Though more expensive than electricity from new gas-fired combined-cycle power plants, wind power is the least-costly renewable alternative for producing large quantities of energy.
Solar: Solar photovoltaic power is often cost-effective for small, remote loads. Applications of this type continue to increase.
Other Projects
Several gas and oil-fired combustion turbines serve peak loads and may generate bulk power when gas prices are low. Other gas or oil-fired small combustion turbines, older steam plants and engine-generator sets provide emergency electricity service.
4-D. Conservation
Conservation is the first-priority electric power resource in the Northwest Power Act, where it is defined as "any reduction in electric power consumption as a result of increases in the efficiency of energy use, production, or distribution." As a result of utility-supported conservation efforts undertaken since the passage of the Act in 1980, the cumulative conservation savings enjoyed by the region's electricity consumers in 1996 amounts to about 1,000 average megawatts. This level of annual savings is equivalent to the power output of five average-sized gas-fired combustion turbines. Utility-funded energy conserved since the passage of the Act amounts to nearly 60 billion kilowatt-hours, with a retail value to consumers of $2.5 billion.
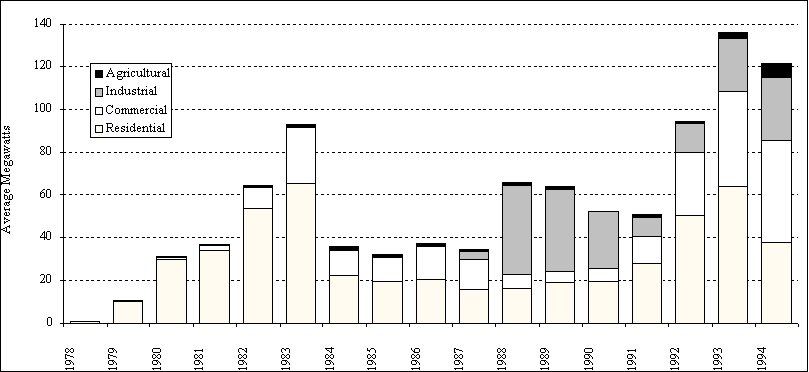
An additional 200 average megawatts are estimated to have been saved through programs, codes and standards at local, state and national levels. Figure 4-5 depicts the annual utility-sponsored first-year conservation savings by sector from 1978 to 1994. This information comes from Nutrak, the Council's Northwest Utility Conservation Tracking System.
To accomplish these savings, the region has weatherized more than half a million homes or apartments, replaced thousands of showerheads with efficient models, installed efficiency measures for a quarter-million irrigated farm acres, produced several hundred thousand new high-efficiency site-built homes and 65,000 high-efficiency factory-built homes, upgraded the residential and commercial energy codes across the region, made conservation modifications to the aluminum refining plants, and developed a thriving energy-efficiency industry. These accomplishments have required perseverance, commitment, fresh thinking and hard work. They also required an estimated outlay of more than $2 billion. The Council has estimated that these savings were acquired at an average real levelized utility cost of about 2 to 2.5 cents per kilowatt-hour, about half the cost of the next most costly resource available at the time.
The pattern of conservation acquisition over time demonstrates some of the flexibility of the resource. After a period of surplus generating capacity in the mid-1980s, the 1991 Power Plan forecast a need for new resources and called for the region to acquire at least 1,500 average megawatts of energy savings by the end of the decade.
Figure 4-5. Regional Summary of First Year Conservation Savings by Sector, 1978-1994
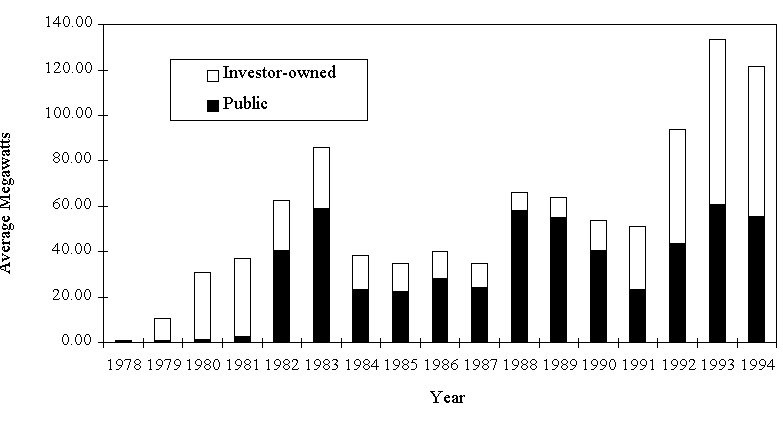
This meant a shift in emphasis from conservation "capability building" to conservation resource acquisition. [Conservation capability building in the mid to late 1980s was directed at maintaining a viable conservation infrastructure and carrying out experimentation to identify viable strategies for conservation acquisition. The major exception to this was the Conservation/Modernization project carried out with the aluminum companies in the late 1980s. The purpose of this project was as much or more to maintain the viability of the aluminum industry in this region in a period of depressed world aluminum prices as it was to acquire conservation savings.] From 1991 through 1994, the region's electric utilities acquired about 400 average megawatts of energy savings, exceeding the expectations of the 1991 plan. Since 1980, the region's public utilities, including Bonneville, have delivered about 56 percent of the total savings, and the investor-owned utilities delivered about 44 percent. The figure below charts the public/investor-owned utility split.
The ups and downs of annual conservation efforts shown in Figure 4-6 are due to the fact that the region was in need of electricity in the late 1970s and early 1980s, and conservation efforts were accelerated. In the early to middle 1980s, the region was in a period of surplus capacity, and conservation efforts were slowed. In the early 1990s, there was again a need for resources, and the region responded once again by increasing conservation efforts. In the mid-1990s, conservation is again being slowed, as utilities see an uncertain future, and inexpensive energy is abundant in the West Coast market.
Fuel Choice
The issue of fuel choice is related to electricity efficiency. The specific issue raised for the Council has been direct use of natural gas in homes and businesses as an alternative to the use of electricity generated by burning natural gas. In 1994, the Council studied the direct use of natural gas in homes. The study found that, although in many cases direct use of natural gas is more energy efficient than electricity use, the most economically efficient resource is very application-specific.
In general, conversion to natural gas is most cost-effective in homes that use a lot of energy. Thus, large homes, poorly insulated homes, or homes in colder climates tend to be the most promising conversion candidates. The Council estimated there might be 730 average megawatts of cost-effective residential fuel conversion savings available in the region. This was primarily from conversions of electric water heaters or electric forced-air furnaces to natural gas. Just as lower avoided electricity costs have reduced the potential amount of cost-effective electricity conservation, so would it reduce the amount of cost-effective fuel conversions.
The Council adopted a policy of considering direct use of natural gas as an alternative to conservation or electricity generation. The policy further stated that market-based approaches were the preferred method of pursuing cost-effective direct gas use. The primary methods of implementing this policy were thought to be encouraging the efficient pricing of electricity and ensuring that conservation incentive payments were not distorting market decisions away from direct use of natural gas where that is the more cost-effective option.
Both of these market-distorting problems are being substantially solved by the restructuring of the electricity industry. Low-priced natural gas generation alternatives have reduced the marginal cost of electricity to near the average cost-based electricity price. As a result, much more accurate price signals are evolving in the electricity market. Electricity market restructuring may also substantially eliminate the ability of electric utilities to make incentive payments for increased electric efficiency. Even before these changes, the market penetration of natural gas had been quite strong in areas where gas is available. With the restructuring of the electricity industry, there is no longer a convincing need to intervene in the fuel-choice market, nor is there really any effective way to do so.
Figure 4-6. First Year Conservation Savings by Utility Type (Public/Investor-Owned)