


- 5-A. Growing Demand for Electricity
- 5-B. Natural Gas Price Forecasts
- 5-C. The Western Power Market
- The Western Generation and Transmission System
- West Coast Resource Availability and Price
- Estimated Level of Reliance on the West Coast Market
- 5-D. New Generating Resource Potential
- 5-E. Hydropower System Uncertainties
This chapter describes the Council's forecasted range of electricity growth and its forecast of natural gas prices. These forecasts help indicate the potential level of increases in electricity use the region might experience. This lays the foundation for looking at what potential resource options are available to fill those growing needs.
This chapter also describes the outlook for the West Coast power market and assesses the amount and cost of electricity available from this market over the long run. As the current surplus in this market is depleted, construction of new generating capacity may resume. Brief descriptions of the estimated cost and quantity of generating resource alternatives that are available for development in the Northwest if new capacity is needed are also included in this chapter. This chapter ends with a description of the uncertainties and future capability of the hydroelectric system and their implications.
5-A. Growing Demand for Electricity
In the midst of all of the changes in the electric power industry, the region's economy continues to grow, and businesses and consumers continue to rely on electricity and other forms of energy as an important component of their activities. It is this growth in economic activity and its changing composition that is the primary determinant of the region's increasing demand for electricity, although that increasing demand is also affected by changing prices for electricity and other fuels.
Economic Patterns
The economic outlook for the Pacific Northwest continues to be strong, although there is always significant uncertainty about the amount of economic growth the region will experience. Recent economic growth in the region has continued to outstrip the nation as it has on average for the last 30 years or more.
Two major categories of business activity are typically distinguished in analyzing regional economic growth. Manufacturing industries are engaged in the transformation of substances or materials into new products. Electricity consumed in these activities is assigned to the industrial electricity demand sector. The second major category of business economic activity, non-manufacturing, includes activities such as services, construction, wholesale and retail trade, mining, agriculture and government. Electricity consumed in these activities is assigned to the commercial demand sector. The electricity used by individual consumers makes up the residential demand sector.
In the past, the region's manufacturing sector has been dominated by natural resource-dependent activities. Lumber, paper and food products accounted for half of the region's manufacturing employment in 1970. Although these industries are still significant, their relative importance is declining. Currently, the largest manufacturing industry in the Northwest is electronics, which is composed of machinery, electrical equipment and professional instruments. The second largest manufacturing industry is transportation equipment, primarily The Boeing Company in Washington. Transportation surpassed lumber and wood products as the largest manufacturing sector in 1989. The historically dominant lumber and wood products industry now makes up the third largest manufacturing industry.
Although receiving far less media attention, the non-manufacturing sector dominates regional employment. These activities account for 85 percent of regional jobs, having grown from an 80-percent share 25 years ago. The largest non-manufacturing sectors are services, retail trade and government. Recent growth has been fastest in business services, health services, engineering services, legal services and restaurants.
The most likely range of economic forecasts shows that the region could add between 1.2 and 2.5 million employees by the year 2015, with 1.7 million added in the medium case. Nearly all of this additional employment occurs in non-manufacturing industries. By 2015, the non-manufacturing share of total regional employment could grow to nearly 89 percent.
Electricity Demand Forecast
The composition of economic growth is an important determinant of the growth in electricity demand because different sectors have significantly different energy requirements. On average, the region's businesses required about 22 megawatt-hours of electricity per employee in 1994. However, the manufacturing sector requires about nine times as much electricity per employee as the commercial, or non-manufacturing, sector. Therefore, the more rapid growth of the non-manufacturing sector tends to gradually reduce the electricity intensity of the region's economy.
Even within the manufacturing sector, there are dramatic differences in the electricity intensities of various subsectors. Four of the 20 subsectors in manufacturing account for about 80 percent of the electricity use. These four are metals, paper, lumber and chemicals. The same four industries, however, account for only 27 percent of the manufacturing sector employment. These large electricity users are generally among the slowest growing industries in the economic forecast, and this tends to further reduce the electricity intensity of the regional economy.
However, there is a new electricity-intensive sector projected to show very rapid growth over the next several years. This is a portion of the electronics industry engaged in the manufacture of silicon wafers, computer chips and microprocessors. The large number of these plants that are expected to come on line over the next several years has the potential of adding about 250 average megawatts of industrial electricity demand.
Personal consumption of electricity occurs in the residential sector. The amount of electricity used per household in the Northwest has been gradually trending downward since 1980 in response to several factors. These include a large electricity price increase around 1980, regional conservation programs and declining natural gas and oil prices starting in the mid-1980s. The medium forecast shows a continued downward trend in residential electricity intensity.
The medium forecast of electricity demand shows that the region could add about 5,920 average megawatts of firm demand between 1994 and 2015. This amounts to an additional 282 average megawatts per year and an average annual growth rate of 1.3 percent.
The demand for electricity is, however, inherently uncertain. For this reason, the Council produces a range of demand forecasts. With resources that are less capital intensive and have shorter lead times, and the emergence of a West Coast surplus power market, the risks associated with demand uncertainty are less than in the past. Nonetheless, it is still worthwhile to consider the implications of demand uncertainty.
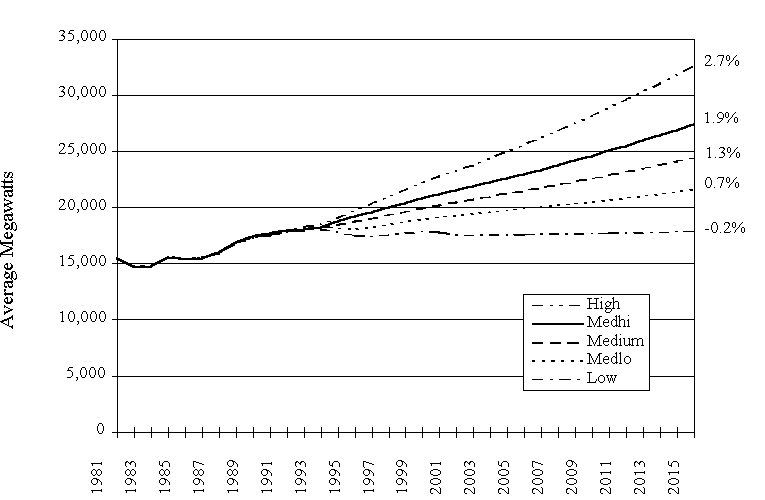
The current electricity demand forecast projects growth rates to be between 0.7 percent and 1.9 percent per year, with equal and relatively high probability. This amounts to a difference of approximately 7,000 average megawatts over the 20-year planning horizon. It is possible, although much less likely, for growth, in the low and high cases, to be as little as negative 0.2 percent or as much as 2.7 percent per year, respectively. This is a difference of more than 14,000 average megawatts over the 20-year planning horizon. Figure 5-1 illustrates the forecast range in a long-term historical context.
Figure 5-1. Demand Forecast Range in a Long-Term Historical Context
The composition of the forecasted use of electricity changes very little between 1994 and 2015. Residential and irrigation shares decrease by 1 percent each with the industrial sector gaining the 2 percentage points. Within the industrial sector, there is a shift away from Bonneville's direct service industries and toward other industrial customers.
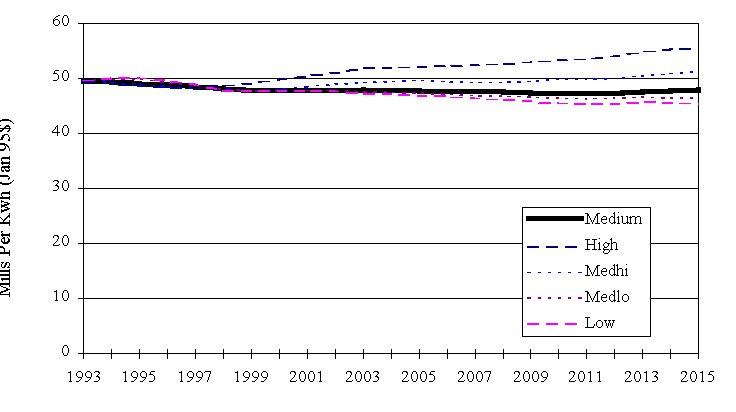
The demand forecasts reflect an expectation that the region will experience generally stable electricity prices that will probably decline slightly in real terms in the medium and lower demand forecasts. This is illustrated for the residential sector in Figure 5-2. These are average rates per kilowatt-hour, including all fixed and variable costs.
Figure 5-2. Forecast of Average Residential Rates
Electricity prices are forecast simultaneously with electricity demand. In past forecasts, electricity price growth was very sensitive to the rate of growth in electricity demand. This is no longer the case for two reasons. First, the cost of new electricity generating capacity is no longer substantially greater than the cost of the existing regional power resources. This is primarily due to the lower forecasts of natural gas prices and the technological advancement in combined-cycle combustion turbines. Second, there is substantial opportunity to improve the use of electricity generating capacity throughout the West Coast power system. The opening up of the wholesale power market will facilitate that improvement. As a result, fewer new resources will be required, and those that are required will be less costly than in the past. The average regional electricity price forecasts are shown in Table 5-1.
Table 5-1. Average Regional Real Retail Electricity Price Forecasts
(1995 Cents Per Kilowatt-hour)
| Forecast Case | 1994 | 2005 | 2015 | Growth Rate
1994-2015 |
| Low | 4.2 | 3.92 | 3.76 | -0.5 % |
| Medium Low | 4.2 | 3.87 | 3.80 | -0.5 % |
| Medium | 4.2 | 3.89 | 3.91 | -0.3 % |
| Medium High | 4.2 | 4.05 | 4.19 | 0.0 % |
| High | 4.2 | 4.30 | 4.65 | 0.5 % |
5-B. Natural Gas Price Forecasts
Natural gas prices have two significant impacts on electricity consumption. First, natural gas prices relative to electricity prices help determine which fuel consumers will select for key pieces of energy consuming equipment, such as space and water heaters. Second, the price of natural gas significantly determines the cost of gas-fired combustion turbines, which in turn is a key resource for new electricity generation. As a result, natural gas prices influence both the amount of electricity consumed and the cost of supplying new resources.
As described later in this chapter, the restructuring of the natural gas industry has resulted in a vibrant market, producing dramatic decreases in natural gas prices and a growing estimate of natural gas supply. Ranges of natural gas and other fossil fuel price assumptions have been declining and becoming narrower since the Council developed its 1991 Power Plan.
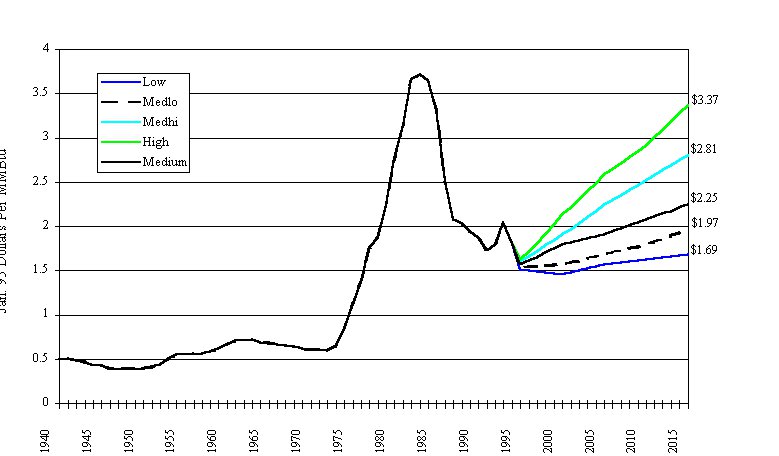
Based on several national gas price forecasts and advice from the Natural Gas Advisory Committee, the medium-case forecast assumes that average real U.S. gas prices will grow at about 1.0 percent annually, increasing from the 1994 level of $1.84 to $2.25 by 2015. The lower cases recognize that real prices may remain flat or even decline slowly over time, and the higher cases explore the possibility that we have become too optimistic about the natural gas future as a result of recent patterns. However, even in the high forecast, gas prices reach only $3.37 compared to a high case of $6.00 contained in the Council's forecast of natural gas prices in October 1992. Figure 5-3 illustrates the historical average U.S. wellhead price and the Council's forecast.
Figure 5-3. Average U.S. Wellhead Natural Gas Prices: Historic and Forecast Range
While national trends in natural gas prices are usually indicative of regional trends, they are not a good indication of actual gas prices in this region. The Pacific Northwest gets most of its gas supplies from Canada and the U.S. Rocky Mountains. These are the two lowest-cost natural gas producing regions in North America. As a result, prices of natural gas delivered into the pipelines serving the Pacific Northwest are substantially lower than prices in most of the country. For example, on October 2, 1995, gas delivered into the U.S. Pacific Northwest from Canada was about $.90 per million Btu, and gas delivered into the pipeline serving the Pacific Northwest from the U.S. Rocky Mountains was $1.04 per million Btu. At the same time, at the Henry Hub in Louisiana, the pricing point for NYMEX gas futures contracts, gas was $1.65 per million Btu. The Northwest's pricing advantage fluctuates with market conditions, but a $.50 advantage is fairly typical.
The low price for Canadian natural gas, which is primarily produced in Alberta and British Columbia, results from the large relatively less-developed gas resources, limited pipeline capacity to move gas out of Canada, and long distances to major gas markets outside the Northwest. These conditions are expected to continue to benefit the Pacific Northwest with relatively low gas prices for the forecast period, although the advantage relative to national prices is expected to decline to some degree in most forecast cases.
The prices of natural gas to final users depends on the cost of transporting and distributing the gas to the point of use. For smaller customers, these costs are a larger share of the delivered cost of natural gas. Because pipeline and distribution costs are not expected to escalate rapidly in real terms, the growth rates of prices to residential and commercial customers are moderated. The medium forecast used for this draft plan is summarized in Table 5-2. The complete range of forecasts may be found in Appendix C.
Table 5-2. Medium Case Forecast of Natural Gas Prices Delivered to End Users
(January 1995 Dollars per Million Btu)
| Case and Sector | 1994 | 2005 | 2010 | Growth Rate
1994-2015 |
| Residential | 5.21 | 5.28 | 5.62 | 0.4 % |
| Commercial | 4.43 | 4.49 | 4.83 | 0.4 % |
| Industrial | 2.30 | 2.57 | 2.88 | 1.1 % |
| Electric Generation | 1.82 (est.) | 2.14 | 2.52 | 1.6 % |
The electricity forecasts indicate that loads could grow by about 5,920 average megawatts by the year 2015, if medium economic growth occurs. There are a number of resources that could be used to meet this load growth, including the West Coast power market, which currently has an abundance of low-cost resources.
The Northwest has traditionally thought of itself as an island of cheap electricity with links to the rest of the West. These Western connections can be used to increase reliability; to dispose of surplus nonfirm hydropower (which was the primary purpose for constructing the Intertie lines between the Northwest and Southwest); and to make exchanges that do not involve net sales of firm energy (e.g., transactions where the Northwest supplies peak capacity and the buyer returns the energy in its off-peak hours or season). Such exchanges were exempted from restrictions under the Northwest Preference Act, which was passed with the initial construction of the Intertie, because they were consistent with the concept of an island of cheap electricity. The closest these ideas came to being challenged were calls for increased reliance on gas-fired combustion turbines or purchases from California gas generation, which could be extensively displaced by nonfirm energy to meet firm Northwest loads. Until very recently, these notions were basically intact.
Several things have dramatically changed this perspective in the last few years. The first is the general assumption that the fall in gas prices in the mid-1980s, described earlier in this chapter, was not an anomaly. The second is the still-unfolding consequence of the Energy Policy Act of 1992 (EPAct), which allowed theFederal Energy Regulatory Commission (FERC) to require open access to the nation's transmission systems and legitimized major non-utility power suppliers, marketers and brokers as players in the nation's power markets. These factors are driving the industry toward a wide-open wholesale power market.
The Western Generation and Transmission System
To estimate how much electricity could be brought into the Northwest from Southern and Southwest markets, the Council analyzed how much transmission was available. To exclude indigenous Northwest resources, the analysis left out the Northwest Power Pool Area of the Western Systems Coordinating Council (WSCC), leaving in only California, the Inland Southwest and the southern Rocky Mountain area. (See map.) This area's generating resources, as of January 1995, are shown in Figure 5-4. Figure 5-5 shows the forecast load and resource balances for the next nine years. Data for both figures are from the WSCC's 1995 planning documents.
Figure 5-4. 1995 WSCC Winter Generating Capability
(Excluding Northwest Power Pool Area)
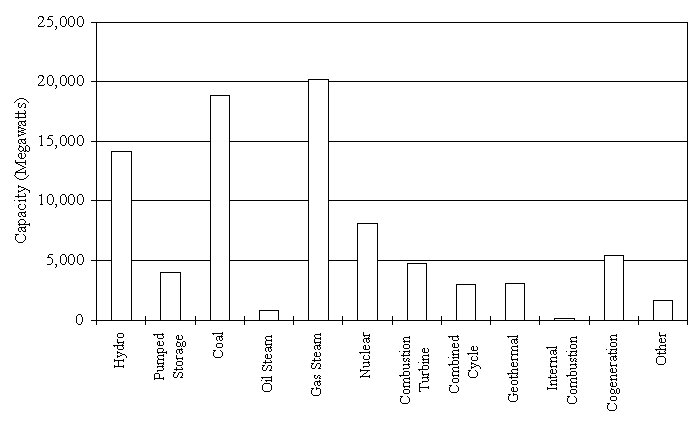
Figure 5-5. WSCC Surplus Above Required Reserves
(Excluding Northwest Power Pool Area)
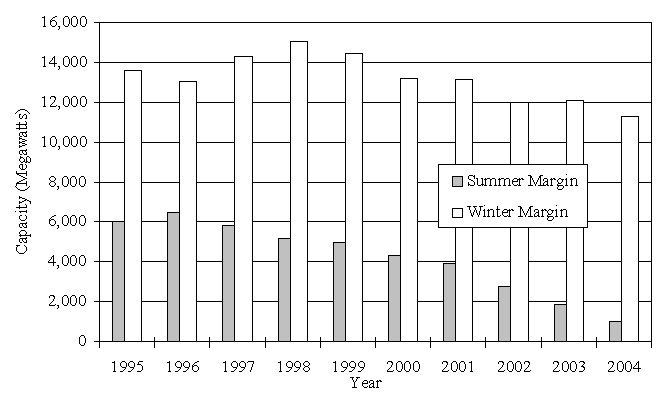
There are three major points to be drawn from these figures. The first is that there is a substantial amount of gas-fired steam generation in this area, when gas prices are low. The second is that there is a surplus during the summer, which is the WSCC's peak period, that extends past the year 2000, although there are important qualifications about the plants that make up the surplus and their marketability. Third, and most importantly, the surplus during the winter, which is the Northwest's peak period, is larger and is likely to extend indefinitely until it is either contracted away to the Northwest or is limited by, for example, air quality concerns at the generation sites.
Transmission Constraints
The Northwest is currently connected to California and the Inland Southwest by two major interties, the AC Intertie to Northern, and to a lesser extent, Southern California, and the DC Intertie directly to Southern California. Southern California is in turn connected to the Inland Southwest, the site of large portions of its own generation, by major 500-kilovolt lines. The ability to import from the Southwest and Southern California to Northern California on the AC Intertie can be limited to as little as 1,300 megawatts under some load and generation patterns. The AC Intertie capability from Northern California into the Northwest is capable of delivering approximately 3,700 megawatts. However there is typically far less electricity available in Northern California, except during good runoff conditions in the spring. At that time, the California hydropower competes with Northwest hydropower on the market.
The DC Intertie can generally be loaded to its full rating, approximately 2,900 megawatts south-to-north, without impinging on reliability criteria based on the stability of the transmission system. However, heavy and long-term reliance on imports on the DC Intertie, which is a single line in a single right of way, to meet loads could incur the risk of not having an alternative contractual pathway in the event of an outage on the line. In recent years, prolonged outages have occurred because of a fire and an earthquake in Southern California.
An additional high voltage line, the Southwest Intertie Project, connecting the Southwest with the Northwest, is in the advanced subscription stage. This line would likely mitigate some of these concerns. Nonetheless even with the completion of a project like the Southwest Intertie, transmission capacity, not prices or generating availability, will be the major constraint on the ability of the Northwest to meet its load growth through purchases from the West Coast market.
West Coast Resource Availability and Price
After accounting for general reliability needs and potential transmission constraints, it would be reasonable for the Northwest to rely on imports of up to 3,500 to 4,500 megawatts in most months, depending on the desired reliability of delivery. This is consistent with the Northwest Power Pool's analysis of the Northwest's reliability for winter 1995/1996, which concluded that up to 4,500 megawatts of imported power on the AC and DC Interties could be safely relied on in the event of extreme winter weather. This is higher than the 3,500 megawatts used in the analysis for winter 1994/1995 because hydropower conditions improved in 1995/1996 in Northern California. For the long-term analysis conducted in this plan, it was assumed that imports would be constrained to 5,000 megawatts in any given month.
The Council's analysis further indicates that prices that might be offered for Northwest imports will be heavily dependent on natural gas prices, which are expected to remain at low levels. Based on the Council's medium natural gas price forecast, electricity delivered to the Northwest borders should generally remain in the low 20-mill range, with increases for on-peak prices likely in the early 2000s. On-peak refers to the daily, and particularly, the seasonal peak periods.
Summer peak-daytime prices could become quite high as Western generating surpluses are worked off and added air-quality constraints are imposed in Southern California air basins, thus reducing the output of gas-fired generating units in the air basin. High prices in summer on-peak periods would provide a market for Northwest nonfirm energy and that would bring in additional capital investment to meet peak loads. However, off-peak prices, particularly in off-peak months, when the Northwest would be most interested in purchasing power, are likely to remain moderate (in the low 20-mill range in 1995 dollars) well into the next decade, given gas prices that track the medium forecast. The analysis, including significant uncertainties and limitations, is described in more detail in Appendix E.
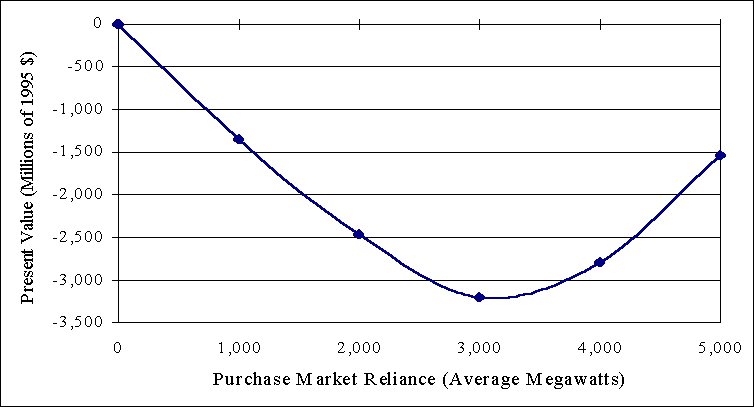
Figure 5-6. Change in System Costs of Power is Purchased from West Coast Market
(Negative values are savings to the system.)
Estimated Level of Reliance on the West Coast Market
If the California and Inland Southwest wholesale power market can be used to maintain reliability and deliver electricity to the Northwest at a price lower than that of new generation, it is likely that the Northwest will develop some level of reliance on wholesale power purchases from the Western power market. [Reliance on the spot market for significant amounts of energy will represent a move away from the traditional critical water planning criterion historically used in the Pacific Northwest power system. Critical water planning is a system planning criterion that sets targets for construction of new generation resources such that demand could be met under the worst historical drought conditions.] This is particularly likely given the estimated price and depth of the out-of-region bulk power market and the strong Northwest interconnections to this market. As a result, these markets significantly affect future resource avoided costs and the value associated with continued implementation of conservation and renewable resources.
Before assessing the cost-effectiveness of developing additional conservation and renewable resources, the Council needed to account for the large amount of inexpensive electricity that could be purchased from the West Coast market. To this end, the Council compared meeting load growth with the construction of new gas-fired combined-cycle power plants in the region to meeting load growth with increasing levels of out-of-region purchases on the market. The results of these studies are summarized in Figure 5-6.
This chart shows the change in future power system costs (expressed as present value dollars) as a function of the level of reliance on out-of-region markets. The market level of zero means that all new resources are in-region combined-cycle gas plants.
The present value of future power system costs for this approach is about $30 billion. As market reliance increases, combined-cycle plant development is displaced by an equivalent amount of purchases. In this study, the expected present-value cost to the region is minimized if the region uses the West Coast market to meet about 3,000 average megawatts of demand growth. The expected cost reduction to the region is about $3.2 billion compared to constructing combined-cycle gas power plants. The mean annual cost savings approach $250 million per year.
The 3,000-average megawatt reliance does not imply a flat 3,000-megawatt purchase year round. In any given month, purchases could be as high as 5,000 megawatts, depending on the long-term transmission capacity constraints described above. Yearly purchase levels will be strongly influenced by demand patterns, available hydropower generation and natural gas prices.
Purchases will generally be greater in the fall and winter and will fall off sharply in the spring and summer, as reservoir storage is used to meet salmon flow targets, and more hydropower is available to meet in-region loads. One of the largest benefits of the spot purchase strategy comes from its ability to adapt to changing hydropower generation patterns. Spot purchases can be used heavily when there are constraints on hydropower generation, but they can be backed off in good hydropower conditions, without incurring the fixed costs of new construction. Thus, spot purchases become another form of the hydropower-firming strategy recommended by the Council in the 1991 Power Plan.
The expected values on the curve in Figure 5-6 represent mean values over 100 future scenarios for the power system. There is significant uncertainty around these points because the future is unknown. The 100 scenarios include a range of low to high load growth, low to high natural gas prices, and uncertainty in the amount of Northwest hydropower generation.
At the 3,000-average megawatt purchase level, the average savings relative to building power plants in the Northwest amount to $3.2 billion. However, in a case with low demand growth, where there is not much need for new construction, the relative savings would be much less. Continually poor hydropower conditions would also produce lower benefits, because it would allow less displacement of purchases and realize less of the flexibility benefit described above. Conversely, higher levels of demand growth, or continually favorable hydropower conditions would produce larger benefits.
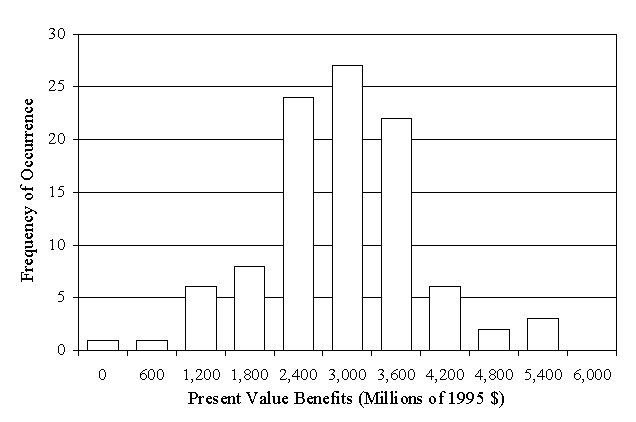
Given the uncertainties incorporated in this analysis, the distribution of potential benefits at the 3,000-average megawatt reliance level ranges from $250 million to more than $5 billion. This is illustrated in Figure 5-7. More than 70 percent of the observations fall within the range from $2.4 billion to $3.6 billion. While the range is very large, at this level of market reliance there are no cases where the market purchase strategy doesn't produce some economic benefit relative to the full combined-cycle power plant strategy. Even over a wide range of potential futures, relying on purchases from the West Coast market produces savings.
The results of this analysis should not be construed as a recommendation by the Council that the region immediately abandon its historic critical water planning criteria and move to complete reliance on out-of-region markets to meet demand growth for the next several years. The Council will have little influence over this process. Decisions to meet load growth through short-term transactions will be made incrementally by individual utilities, based on the economics and reliability of proposed transactions. However, the potential economic benefits to the Northwest appear to be large, and it is the Council's judgment that reliance on the market needs to be incorporated into the analysis of the cost-effectiveness of conservation and renewable resources. To that end, a long-term market reliance level of 3,000 megawatts was incorporated into the analysis of the cost-effectiveness of conservation and renewable resources. For conservation or renewable resources to be found cost-effective, their costs to the region had to be lower than reliance on purchases from the market.
Figure 5-7. Distribution of Benefits from Reliance on the West Coast Market
(3,000-Megawatt Level)
5-D. New Generating Resource Potential
A supply curve showing the estimated cost and quantity of new resource alternatives available for development in the Northwest is illustrated in Figure 5-8. Table 5-3 contains the corresponding data. Capsule descriptions of the generation supply alternatives follow. Further information regarding conservation potential is provided in Chapter 6 and in Appendix G. Additional information regarding generating resource potential is provided in Appendix F.
Coal: A practically unlimited supply of low-cost, low-sulfur coal is available to the Northwest. Gasification and other advanced technologies have improved the efficiency and reduced the environmental impacts of coal-fired generation. Additional coal-fired generation could supply 5,000 average megawatts, or more, of energy at costs of 3.7 to 4.2 cents per kilowatt-hour. These costs are expected to remain relatively stable, but they would be sensitive to carbon dioxide control measures. Constraints to the development of additional coal-fired power plants include public resistance to transmission line construction, cooling water supplies at arid sites, local air-quality impacts, environmental impacts of mining and transporting coal, and the risk that carbon dioxide emissions will be taxed.
Forest thinning residue: Some proposals for restoring degraded east-side forests involve selective removal of trees. These thinnings would be marketed as saw logs or pulping chips where possible. Unmerchantable materials could be chipped and distributed on-site or, alternatively, used as a power plant fuel. About 300 to 1,000 average megawatts could be generated using forest thinnings, at costs ranging from 5.1 to 6.2 cents per kilowatt-hour. These megawatt estimates are fairly uncertain. The cost estimates allocate the full cost of the forest thinning process to power production (i.e., including no subsidy from forest restoration programs). Costs are expected to decline slowly as biogasification technology is introduced. Development of this resource would require resolution of the controversy regarding the appropriate approach to east-side forest restoration.
Figure 5-8. New Resource Costs and Availability
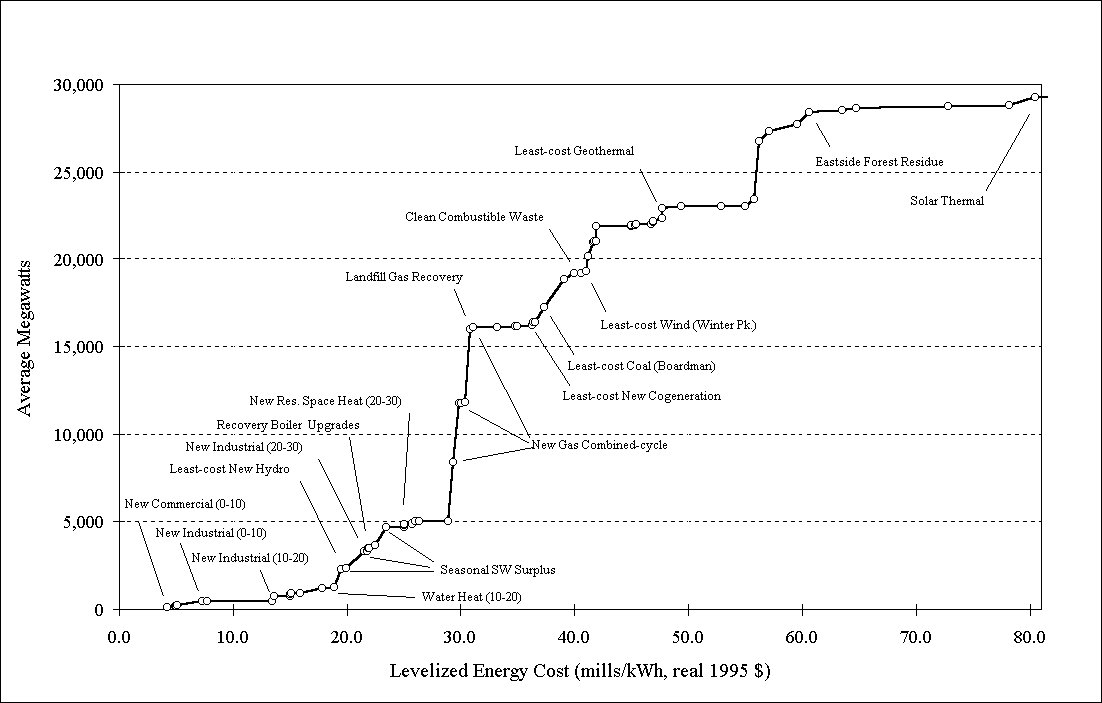
Table 5-3. Conservation and Generating Resource Supply Summary
| Resource Name [The mill ranges appearing in the resource names (e.g. "0-10 m/kWh") designate resource blocks and may only approximate the actual cost of resources in the block. The actual average cost of the resource block is shown in the Levelized Cost column.] | Levelized Cost (Real, 1995 mills/kWh) [These levelized costs assume investor-owned utility financing, 15-year amortization of capital costs for generating resources. Levelized costs for conservation resources are based on the average of investor-owned and public utility financing, with the amortization life being 15 years or the life of the conservation measure, whichever is shorter. ] | Average Megawatts |
| New Commercial 0-10 m/kWh | 4.2 | 123 |
| Commercial Remodel & Retrofit 0-10 m/kWh | 4.9 | 39 |
| Existing Residential Space Heat 0-10 m/kWh | 5.0 | 9 |
| New Residential Space Heat 0-10 m/kWh | 5.0 | 1 |
| Existing Commercial 0-10 m/kWh | 5.1 | 46 |
| New Industrial 0-10 m/kWh | 7.3 | 260 |
| Irrigation 0-10 m/kWh | 7.7 | 2 |
| Irrigation 10-20 m/kWh | 13.5 | 5 |
| New Industrial 10-20 m/kWh | 13.7 | 264 |
| Existing Residential Space Heat 10-20 m/kWh | 15.0 | 17 |
| New Residential Space Heat 10-20 m/kWh | 15.0 | 97 |
| Existing Commercial 10-20 m/kWh | 15.1 | 42 |
| Freezers 10-20 m/kWh | 15.9 | 17 |
| Water Heat 10-20 m/kWh | 17.9 | 291 |
| New Commercial 10-20 m/kWh | 18.9 | 48 |
| New Small Hydropower - Least-cost | 19.9 | 64 |
| Irrigation 20-30 m/kWh | 21.8 | 6 |
| New Industrial 20-30 m/kWh | 21.9 | 126 |
| Commercial Remodel & Retrofit 10-20 m/kWh | 22.0 | 15 |
| Chemical Recovery Cogeneration Upgrades | 22.5 | 195 |
| Existing Residential Space Heat 20-30 m/kWh | 25.0 | 1 |
| New Residential Space Heat 20-30 m/kWh | 25.0 | 129 |
| Compact Fluorescent Lighting 20-30 m/kWh | 25.1 | 47 |
| New Commercial 20-30 m/kWh | 25.8 | 70 |
| Refrigerators 20-30 m/kWh | 26.0 | 88 |
| Water Heat 20-30 m/kWh | 26.4 | 22 |
| Irrigation 30-40 m/kWh | 28.9 | 8 |
| New Natural Gas Combined-cycle, Permitted Sites | 29.3 | 3356 |
| New Natural Gas Combined-cycle, New Sites | 29.9 | 3356 |
| Commercial Remodel & Retrofit 20-30 m/kWh | 30.0 | 22 |
| Existing Commercial 20-30 m/kWh | 30.4 | 49 |
| New Natural Gas Combined-cycle (Dry Cooling) | 30.8 | 4140 |
| Landfill Gas Energy Recovery | 31.1 | 126 |
| New Industrial 30-40 m/kWh | 33.2 | 13 |
| New Commercial 30-40 m/kWh | 34.8 | 25 |
| Existing Residential Space Heat 30-40 m/kWh | 35.0 | 20 |
| New Residential Space Heat 30-40 m/kWh | 35.0 | 10 |
| Existing Commercial 30-40 m/kWh | 36.3 | 42 |
| New Industrial Cogeneration 40 m/kWh and less | 36.4 | 156 |
| Irrigation 40-50 m/kWh | 36.6 | 8 |
| New Boardman Coal Gasification | 37.3 | 867 |
| New Colstrip Coal Gasification | 39.1 | 1627 |
| Clean Combustible Industrial and Municipal Waste | 40.0 | 300 |
| Commercial Remodel & Retrofit 30-40 m/kWh | 40.6 | 8 |
| Wind - Least-cost Winter Peak | 41.0 | 117 |
| New Valmy Coal Gasification | 41.2 | 841 |
| New Centralia Coal Gasification | 41.6 | 867 |
| Existing Commercial 40-50 m/kWh | 41.8 | 68 |
| Water Heat 30-40 m/kWh | 41.9 | 12 |
| Thousand Springs Coal Gasification | 41.9 | 852 |
| Existing Residential Space Heat 40-50 m/kWh | 45.0 | 2 |
| New Residential Space Heat 40-50 m/kWh | 45.0 | 11 |
| New Industrial 40-50 m/kWh | 45.0 | 11 |
| Freezers 40-50 m/kWh | 45.3 | 16 |
| New Commercial 40-50 m/kWh | 45.4 | 42 |
| Wind - Least-cost Spring - Summer Peak | 46.7 | 32 |
| New Small Hydropower - Medium Cost | 46.9 | 89 |
| New Commercial Cogeneration 50 m/kWh and less | 46.9 | 84 |
| New Industrial Cogeneration 40-50 m/kWh | 36.4 | 156 |
| Geothermal - Least-cost | 47.7 | 576 |
| Wind - Medium Cost Winter Peak | 49.4 | 116 |
| Commercial Remodel & Retrofit 40-50 m/kWh | 52.9 | 13 |
| Existing Residential Space Heat >50 m/kWh | 55.0 | 2 |
| New Residential Space Heat >50 m/kWh | 55.0 | 4 |
| Wind - High Cost Winter Peak | 55.8 | 358 |
| New Industrial Cogeneration 50-60 m/kWh | 56.2 | 3339 |
| New Commercial Cogeneration 50-60 m/kWh | 57.1 | 552 |
| Geothermal - Medium Cost | 59.6 | 414 |
| Eastside Forest Thinning Residues | 60.6 | 692 |
| Wind - High Cost Spring - Summer Peak | 63.5 | 79 |
| Water Heat >50 m/kWh | 64.7 | 152 |
| Geothermal - High Cost | 72.8 | 86 |
| New Small Hydropower - High Cost | 78.2 | 45 |
| Central Station Solar Thermal | 80.5 | 467 |
| Existing Commercial >50 m/kWh | 82.6 | 11 |
| * New Commercial >50 m/kWh | 125 | 11 |
| * Commercial Remodel & Retrofit >50 m/kWh | 146 | 4 |
| * Rooftop Solar Photovoltaics, Eastside | 192 | 30 |
| * Not shown in Figure 5-8 | ||
Geothermal: The Northwest is thought to have large geothermal resource potential, but the feasibility of commercial generation of electricity from the resource has yet to be demonstrated. An estimated 400 to 3,900 average megawatts could be secured from geothermal resources in the Northwest and neighboring areas at costs of 4.9 to 7.3 cents per kilowatt-hour. Both quantity and cost estimates are highly uncertain. Costs are expected to decline slowly with the introduction of improved technology. Technology development will, to some extent, be driven by the petroleum industry because of developments in well drilling and other subsurface exploration techniques. Issues associated with geothermal generation include environmental impacts (noise, hydrogen sulfide, geothermal fluids and disposal of drilling materials), effects on hydrothermal systems, and conflicts with ecologically sensitive areas and recreational sites. Projects intended to demonstrate the feasibility of geothermal electric power generation are under development at three Northwest resource areas.
Hydropower: About 170 average megawatts could be secured from new hydropower resources at costs ranging from about 1 cent to 6.5 cents per kilowatt-hour. This estimate includes expansions to existing hydropower projects, addition of power generation to non-power water control structures and development of high-head, small-scale headwater sites. This estimate does not include efficiency upgrades at existing hydropower projects, additions to existing facilities for the primary purpose of securing capacity, or pumped-storage projects. Hydropower is a mature technology, and costs are expected to remain relatively stable. Habitat modification, stream-flow and water-quality effects, erosion and sedimentation, and land and water use conflicts are issues limiting development.
Industrial cogeneration: Cogeneration plants can supply industrial electricity, space and process heating, and cooling loads. Surplus electricity can be sold back to the electrical grid. The enhanced overall thermal efficiency of cogeneration can reduce the cost and environmental impact of supplying overall energy needs. Fuels used for industrial cogeneration include natural gas, fuel oil, spent pulping liquor, wood residues and coal. Many technologies are available for cogeneration, including reciprocating engines, combustion turbines and steam boilers. Installations are often sized ("thermally matched") to the thermal load of the facility. In theory, thermal matching produces the greatest efficiency and environmental benefits. Alternatively, the power plant can be constructed and operated primarily for power generation, and a relatively small amount of steam could be bled to an adjacent industrial plant.
Cogeneration is common in industries with large thermal loads and on-site production of residue fuels. In the Northwest, these include the pulp and paper, wood products and petrochemical industries. As much as 4,600 megawatts of additional industrial cogeneration could be developed in the Northwest, primarily in the food processing, wood products, pulp and paper, petrochemical, rubber and plastic, primary metals and transportation equipment sectors. The potential would be smaller if the plants were built to be thermally matched.
The cost of electricity from these plants would range from about 2.5 cents to 6.0 cents per kilowatt-hour, with most above 4.0 cents. Improvements in generating technology should help stabilize industrial cogeneration costs. Impediments, in addition to cost-effectiveness, include competing investment opportunities, short payback criteria, and uncertainties regarding the long-term viability of some plants. Benefits include improved reliability of power and steam supplies, and reduced air emissions and water consumption.
Renovation of existing cogeneration installations may present special opportunities for cost-effective cogeneration in the near-term. For example, additional power generation can be secured by upgrading older pulping chemical recovery boilers or by adding generating capability to units. The regionwide potential of chemical recovery plant upgrades and additions is estimated to be as much as 195 average megawatts. A representative cost of energy from projects of this type is 2.3 cents per kilowatt-hour. The cost of specific projects will vary because of the unique circumstances at each facility.
Landfill gas energy recovery: Anaerobic decay of landfilled materials produces a gas containing high concentrations of methane. In most cases, this gas is collected and flared. Another alternative is to use this gas to fuel engine-generator sets or small combustion-turbine power plants. Energy recovery from landfill gas could provide about 125 additional average megawatts at an incremental cost of about 3.1 cents per kilowatt-hour. Landfill gas recovery uses relatively mature technology, and costs are not anticipated to decline significantly. There are few impediments to the development of this resource.
Mixed wood residues: Because of public concerns regarding transportation, air-quality impacts and impacts on recycling programs, it is unlikely that new power plants burning unsorted municipal solid waste will be developed in the foreseeable future. However, clean combustible materials sorted from the municipal solid waste stream and combined with wood residues from industrial sources could be used to fuel new power plants or augment the fuel supply for existing plants.
Energy recovery from clean combustible wastes could provide about 300 average megawatts at costs of 4 to 5 cents per kilowatt-hour. Resource availability is uncertain and may decline as higher-value uses for combustible residues develop. Cost is sensitive to plant size, fuel transportation requirements and the value of cogenerated steam. These costs are expected to decline as biogasification technology is introduced. Biogasification technology will also permit use of agricultural residues, expanding the supply of potential fuel. Impediments include competing higher-value uses for residues, fuel transportation costs and land use conflicts.
Natural gas - bulk power generation: An abundant supply of inexpensive natural gas is available from western Canada and Rocky Mountain fields. Declining gas prices, surplus gas transportation capacity, natural gas price risk-hedging instruments, improvements in combustion turbine performance, decline in equipment and construction prices, and apparent ease of project permitting have resulted in gas-fired combined-cycle combustion turbines emerging as the least-cost alternative for new bulk power generation. Sites capable of supporting 7,400 megawatts of additional combined-cycle combustion turbine capacity appear to be available. These could provide 6,800 average megawatts of energy at 2.7 to 3.2 cents per kilowatt-hour (medium gas price forecast). Some of these plants could provide steam to nearby industries.
Technology improvements are expected to offset slowly escalating natural gas prices, while capital costs are likely to remain at current levels. This should lead to stable or slowly escalating electricity costs. Gas-fired combined-cycle power plants can be developed quickly, and have low capital costs and excellent operating flexibility. Issues include long-term gas price stability, nitrogen oxide emissions, consumption of water for cooling and the environmental impacts of natural gas production and processing. The potential effect of carbon dioxide controls is unclear. Because gas-fired combined-cycle plants produce less carbon dioxide than other fossil fuel plants, new gas-fired combined-cycle plants might be substituted for older fossil units.
Natural gas - commercial building cogeneration: Cogeneration plants can supply the space heating and cooling, hot water and electrical needs of commercial buildings. Surplus electricity can be sold back to the electrical grid. The enhanced overall thermal efficiency of cogeneration can reduce the cost and environmental impact of supplying energy requirements. Natural gas is the preferred fuel for commercial cogeneration, and many technologies are available including reciprocating engines, combustion turbines and steam boilers. Packaged fuel cell cogeneration plants have recently appeared on the market. Existing applications are typically confined to relatively large thermal loads such as college campuses.
About 640 megawatts of new commercial cogeneration is estimated to be available for development, primarily in the hospital, military and correctional sectors. The cost of electricity from these plants would range from about 4.5 to 6.0 cents per kilowatt-hour. Though high compared to current market prices, commercial cogeneration costs may be partially offset by transmission and distribution cost savings. The cost of commercial cogeneration is expected to remain stable as improvements in generating technology offset fuel cost escalation. Production-driven improvements in fuel cells could lead to substantial improvements in the cost-effectiveness of commercial cogeneration. In addition to cost, impediments to commercial cogeneration include interconnection issues, competing investment opportunities, short payback criteria, and air quality and other local environmental impacts.
Nuclear: The partially completed WNP-1 and WNP-3 nuclear plants were preserved for many years in case they were needed in the future. However, Bonneville terminated preservation funding as the cost of alternative sources of power declined. Although the units remain intact, completion of either is unlikely unless it is federally financed as a plutonium disposal project.
Advanced, passive-safety, modular plant designs have been developed to counter public concerns regarding plant safety and to reduce costs to competitive levels. The first advanced, passive-safety plant was intended to be in service by 2003. However, no plants of advanced design are currently planned for construction. The design goals for advanced passive-safety plants would result in energy costs of about 4.3 cents per kilowatt-hour. Experience with other new technologies suggests that target costs are unlikely to be achieved. Nuclear plants could produce large quantities of base-load energy without significant carbon dioxide production. However, the capital-intensive nature of nuclear technology, public concerns regarding plant safety and nuclear waste disposal, and performance uncertainties associated with new nuclear technologies are major constraints.
Ocean energy: Limited wave power potential may be present along the outer coast. Because of immature technology, environmental concerns and high costs, the development of this resource is not anticipated in the foreseeable future.
Solar: Southeastern Oregon and southern Idaho have relatively good solar insolation and large areas suitable for the installation of solar generating equipment. But the resource is diurnal and intermittent and seasonally non-coincidental with most Northwest loads. The least-cost central-station solar generation technology currently available is parabolic trough with supplemental natural gas boiler. The estimated cost of electricity from a hybrid gas/solar parabolic trough at prime Northwest solar resource sites is about 8 cents per kilowatt-hour.
Small-scale photovoltaic applications, at current costs of 20 to 25 cents per kilowatt-hour may be cost-effective in locations that are difficult to serve with grid power. Photovoltaic costs are expected to continue to decline at a relatively rapid rate, and small-scale applications providing distributed system benefits are expected to become increasingly common. Central-station solar generation would first become competitive in the Southwest, where good temporal and geographic coincidence between insolation and loads is present.
Wind: The Northwest possesses numerous wind resource areas suitable for electric power generation. The aggregate potential is in the thousands of megawatts, but the greater portion is in north-central Montana, remote from the region's load centers. The best wind sites have a potential of yielding about 700 average megawatts (in addition to current projects) at costs ranging from 3.6 to 7.5 cents per kilowatt-hour. This assumes only limited development of the prime Blackfoot wind resource area of north-central Montana, because of transmission constraints. The quantity estimate is subject to uncertainties regarding wind resource area quality, extent, developable area and turbine array density. The cost estimate excludes the federal production incentive, scheduled to expire for projects placed in service after 1999.
Technology improvements and production economies are expected to provide continued cost reduction. Impediments include transmission constraints, avian mortality and aesthetic impacts. The resource is intermittent, and the winds of some otherwise favorable resource areas are not seasonally coincidental with regional loads. Four commercial-scale wind power projects are under development in the Northwest.
General Prospects for Development of New Generating Resources
Though electrical load growth in the Northwest is expected to continue at rates comparable to the past several years, few new generating projects are scheduled for development. Rather, utilities (and some consumers) are meeting new loads by wholesale power purchases. Northwest peak period (fall and winter) wholesale prices reflect the variable cost of operating existing generating plants located in the Southwest. Many of these are older dual-fuel (natural gas or fuel oil) steam-electric units in California. These plants were not economical to operate for other than peaking purposes for many years because of high fuel prices. The decline in natural gas prices has enabled the operators of these plants to produce competitive base-load power. Moreover, the variable costs of many of these units are lower than the fully allocated costs of new combined-cycle plants, the least-costly new bulk generating resource.
The flexibility of wholesale purchases is attractive in a time of uncertainty and change in the industry. Wholesale contracts require little lead time, require no capital investment and are available for short durations.
Wholesale prices are forecast to gradually rise because of natural gas price escalation and the cost of implementing more stringent nitrogen oxide emission controls on older gas-fired power plants. [The latter can be achieved by acquisition of emission offsets, addition of nitrogen oxide controls to existing plants or by repowering or replacing existing steam-electric plants with new combined-cycle technology.] Even considering these costs, off-peak power from the Southwest is expected to remain highly competitive with new generation. As wholesale power prices rise toward the fully allocated cost of new resources, construction of new plants will eventually resume.
Because of their low cost, an abundance of suitable sites and favorable technical and environmental characteristics, natural gas-fired combined-cycle power plants are the most likely new bulk power generating resource alternative. Continuing technical improvements are expected to partially offset increases in natural gas prices. A few new hydropower projects, upgrades of existing hydropower and thermal plants, and a few new plants using biomass residues will likely be competitive with new gas-fired combined-cycle combustion turbines in the near-term. Technological improvements and production efficiencies are expected to improve the competitive position of many renewable resources and coal-fired power plants (Figure 5-9).
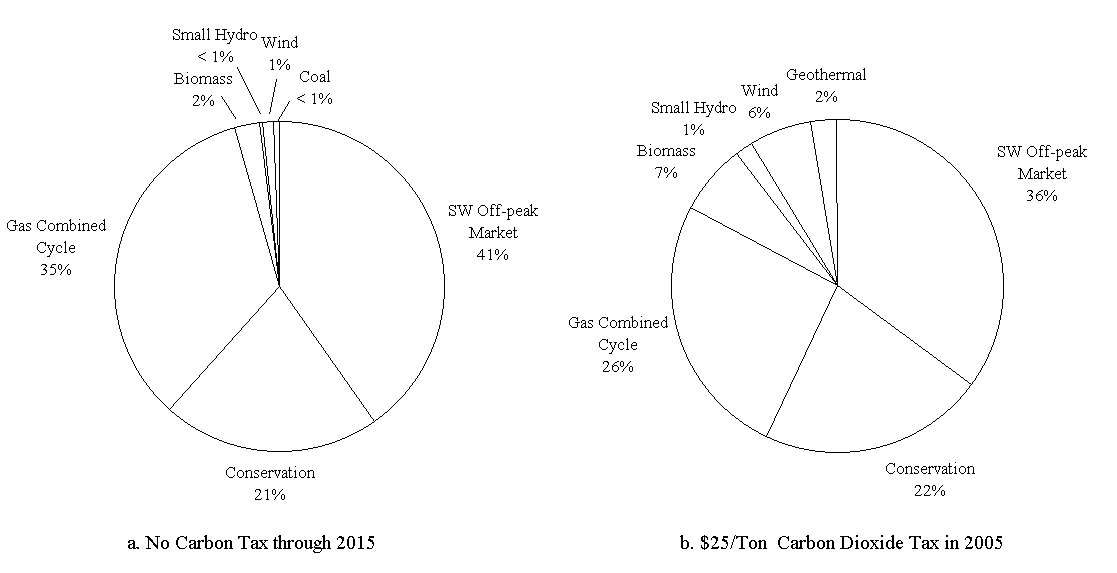
Absent controls on greenhouse gas emissions, new resource needs for the next decade, or longer, will mostly be met with off-peak operation of Southwestern plants, new gas-fired combined-cycle plants, and, possibly, continuing conservation activities (Figure 5-10a). Greenhouse gas controls (such as a carbon tax) could significantly affect this picture. The competitive positions of conservation, renewables and nuclear options would improve relative to existing and new fossil-fuel alternatives (Figure 5-10b). The role of natural gas in this situation is somewhat unclear. Because of their high thermal efficiency and low carbon-content fuel, gas-fired combined-cycle plants might be economic substitutes for older coal or gas-fired steam plants.
Figure 5-9. Resource Cost Trends
[The increase in the cost of wind-generated electricity shown for year 2000 is due to scheduled expiration of federal production incentives. The mid-term increases in the cost of forest thinning biomass is due to the near-term availability of several retired biomass power plants that can be refurbished.]
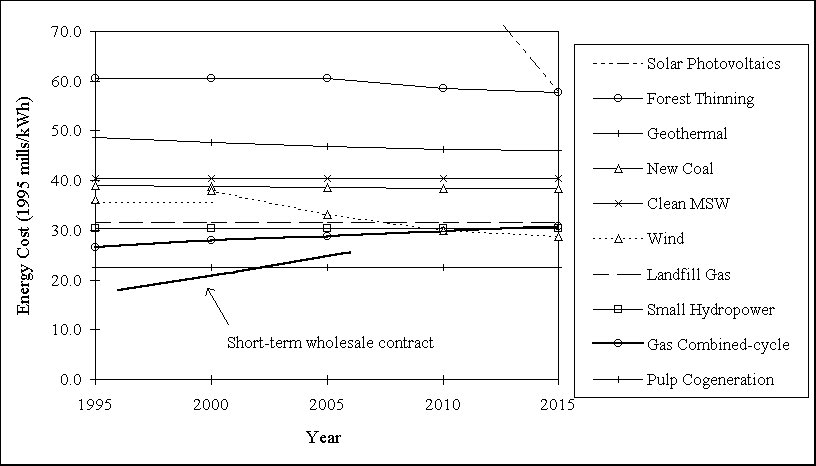
Figure 5-10. Effect of a Carbon Tax on the Mix of New Resource
5-E. Hydropower System Uncertainties
Another uncertainty the Northwest is facing is how much of the hydroelectric system will be available to generate electricity given operational changes to the system intended to increase fish survival. The existing hydroelectric system and current operations are described in Chapter 4. This section outlines the types of energy and capacity impacts that could occur from changing the operation of that system in an attempt to aid fish.
Congress has recently implemented a budget limitation on Bonneville's expenditures for salmon restoration, including actual program costs and costs for fish-related power purchases and lost revenues. This could provide an adequate budget to maintain current river operations. However, as more information is gathered and more research is conducted, the operation of the river may be further modified. This could lead to more or fewer constraints, depending on the results of the research. This uncertainty is similar to the possibility of a future carbon tax. It may happen, but the timing, magnitude and likelihood is unknown.
It is not now known what set of fish and wildlife recovery measures the region will eventually implement. The Council's Columbia River Basin Fish and Wildlife Program, [Document #94-55, Columbia River Basin Fish and Wildlife Program , December 14, 1994, Northwest Power Planning Council.] the National Marine Fisheries Service's biological opinion [Proposed Recovery Plan for Snake River Salmon , March 1995, U.S. Department of Commerce, National Oceanic and Atmospheric Administration.] and the Columbia River Anadromous Fish Restoration Plan [Wy-Kan-Ush-Mi Wa-Kish-Wit - Columbia River Anadromous Fish Restoration Plan of the Nez Perce, Umatilla, Warm Springs and Yakama Tribes , Vol. 1, June 15, 1995, Columbia River Inter-Tribal Fish Commission.] have all been proposed as salmon recovery plans. Each suggested operation is different and affects the hydroelectric system's capability to produce electricity in different ways. Each scenario would change, to varying degrees, the hydroelectric system's ability to provide both firm energy and peaking capacity. Each scenario could lead to a different set of resource actions for the region.
The current analysis uses an estimate of the availability of hydroelectricity based on the National Marine Fisheries Service's biological opinion. To provide an idea of the size of changes that could be faced, three additional scenarios were analyzed and are described below. They span a range of potential river operations with impacts that are between a gain of 500 average megawatts to a loss of 3,000 average megawatts compared to the biological opinion. Table 5-4 summarizes the impacts of the base case and three additional scenarios relative to current operations. The energy figures shown are the net energy losses. No attempt was made to determine the change in the firm energy load carrying capability (FELCC) of the system.
Water budget operation: This scenario assumes river operations as they were in 1991. It represents an operation with energy and capacity gains compared to current operations. It was the operation in place for the 1991 Power Plan.
Drawdown proposal: This scenario reflects a hypothetical operation that produces both higher energy and capacity losses than current operations. It includes a drawdown of the four lower Snake River dams to natural river elevations year round. All of the energy and capacity from those projects is lost. It should be noted that this is not the same river operation as is contained in the Council's Columbia River Basin Fish and Wildlife Program's Strategy for Salmon.
Tribal proposal: This scenario represents an operation that reduces both the firm energy and capacity of the system well beyond current levels. The operation proposed in the Columbia River Anadromous Fish Restoration Plan is used for this case. This operation calls for higher flow augmentation in both the Snake and Columbia rivers and a drawdown to natural river elevations year round at the four lower Snake River dams and at the John Day Dam.
Table 5-4. Hydroelectric Energy and Capacity Gains or Losses Relative to the 1995 Biological Opinion
[This table reflects only the gain or loss of generating capacity compared to operation under the Biological Opinion. It does not reflect shifting hydrogeneration to other months, when it is not lost, but it may have less value. Calculated losses to firm generating capacity (FELCC) include both factors. The effect on electricity generation from the base case used here -- the Biological Opinion -- is discussed more fully in Chapter 4.]
| Case | Water Budget | Drawdown Proposal | Tribal Proposal |
| Energy Impacts
(average megawatts) |
+500 | -1,300 | -3,000 |
| Capacity Impacts
(megawatts) |
+800 | -2,700 | -5,200 |
The issue for this draft power plan is whether these potential hydropower changes would lead to different resource choices. In general, the answer is no. The availability of additional market purchases in the near term, plus relatively short lead time resources like combined-cycle combustion turbines mean the region could adapt to further losses of hydroelectric capacity, albeit at a cost. Losses on the order of either the Drawdown Proposal or the Tribal Proposal scenarios would require lead time to build replacement resources or increase transmission capability to maintain reliable service. Replacement resources, for example, require from two to five years to bring into service. If needed, intertie expansions might require additional lead time because of the controversy that often accompanies the construction of new, or expansion of existing, transmission lines. On the other hand, were hydroelectric system restrictions to be eased, thus increasing hydroelectric capability, the region would generally be able to reduce more expensive short-term purchases from the Western market.