The Council has requested that the Independent Economic Analysis Board (IEAB) prepare an estimate of the economic value of commercial, tribal, and recreational fisheries' on Columbia River Basin salmon and steelhead, both wild and hatchery (Council's IEAB Task Order 87). This report was prepared to describe some of these values. The report focused on current fisheries, their contribution to local economies, and the sources of the salmon and steelhead that support these fisheries. It also provides some historical context and identifies significant changes that have affected fisheries over time.
Fishing has a long history in the Columbia River Basin. To the Indians living along the Columbia River, salmon were their lifeblood, essential to their subsistence, their culture, and their religion. A focal point of this great salmon fishery for many centuries was Wy-am, one of the longest continuously occupied sites on the North American continent. Located near Celilo Falls on the Columbia River, the Wy-am area, before the Dalles Dam in 1957, was a commercial center during the fishing season. In autumn, as many as 5,000 people would gather to trade, feast, and participate in games and religious ceremonies.
Salmon played a key role in developing the West by European settlers. As early as 1828, various trading companies were purchasing and exporting salmon caught by the Indians on the Columbia River. The first commercial use of fishery products in Oregon was the packing of salmon. Development of the canning process in the mid 1800's created a huge demand for salmon. The total harvested pounds of salmon and steelhead in the early 1890's ranged from 21 million pounds to 40 millions pounds. During the late 1880's and early 1920's, the salmon gillnet fishery in the Columbia River pumped a substantial amount of income into communities on the lower Columbia River, such as Astoria.
The history of Columbia River salmon harvest exhibits a transition from hand-held spears and dip nets, to riverboats with purse seines and gillnets, to ocean-going vessels with diesel engines and trolling poles. Originally, harvesters waited until salmon returned to the Columbia River. When salmon became scarcer and gas powered engines allowed fishermen to venture out farther into the ocean, trolling for salmon became an attractive alternative. As ocean fisheries developed, a growing share of the fish produced in the Basin was harvested in the ocean. Today, salmon produced in the Columbia River system are harvested from California to Alaska by trolling gear and by nets set to harvest other species of salmon. The effect of economic development in the Columbia Basin, hatchery production, and mixed stock, open access fisheries has been to reduce the total harvest and change the species and stock composition of salmon returning to the Columbia River. The change in the nature of the harvest patterns and the decline in total Columbia Basin production has resulted in fewer fish available for harvest in the Columbia River. Commercial landings of salmon and steelhead harvested in the Columbia River declined from around 20 million pounds in the late 1940's to a very low level in 1993, when a total of just over one million pounds of salmon was harvested.
Another trend is that, in the last two decades, farmed salmon has grown to provide more than half of the world salmon market. This infusion of new supply has resulted in significant reductions in salmon prices that, combined with reduced catch, has put substantial economic pressure on commercial salmon fisheries. As returning fish numbers have declined, so have the revenues received by fishermen and the resulting household income generated for inland communities. Some of these trends may be changing. Adult salmon and steelhead numbers have always been volatile, depending on ocean and other conditions. Since 2000, numbers of adult salmon and steelhead available for harvest have increased dramatically. Increased prices for certain salmon products during the 2004 season may indicate increased demand for specialty products, such as "wild caught" salmon. Another recent trend is the rapid decline in the U.S. dollar. This has also increased prices for most salmon products.
This analysis estimates the contribution of salmon and steelhead to coastal and Columbia River communities in recent years. The estimate includes both wild and hatchery fish, and economic value from both commercial harvests and recreational harvests wherever they occur. Tribal harvests for commercial markets are included. Ceremonial and subsistence catch is not included.
The report uses regional economic impacts (REI) as the measure of value. The unit of value is household personal income. REI should be viewed as the income generated by harvesting, and in the case of commercially harvested fish, preparing a marketable product, plus the indirect or secondary impacts on other economic activities, commonly called the "multiplier effect." The contribution of surplus hatchery fish sold to fish processors is included. The REI calculations are for household income generated in communities wherever Columbia River Basin salmon and steelhead are caught, communities extending from Alaska and British Columbia to northern California.
REI measures the amount of income that is related to the fisheries. It measures economic contribution under current conditions and is not a valid measure of the long-term effects on the economy of changes in fish abundance or policy. It provides a measure of the short-term dislocations and adjustments that might be caused by collapse of the fishery.
The REI is not a measure of economic benefit. Economic benefits might include consumer surpluses of recreational fishermen, certain non-use values such as tribal subsistence and ceremonial harvests, certain industry costs or cost savings, and a variety of other economic values not analyzed in this paper. Economic benefits would be a more appropriate measure to show the long term effects from changes in the fishery.
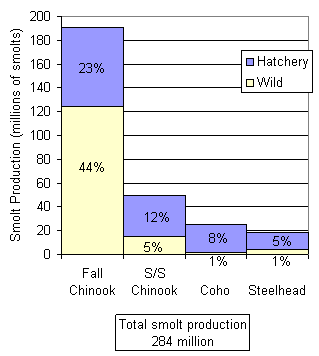
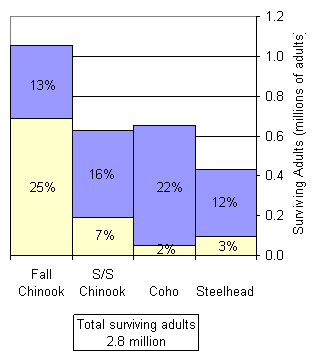
In the early 2000's, the Columbia Basin produced about 284 million smolts (Figure ES.1). Overall, about 48 percent of this production is by hatchery and 52 percent through natural production. The surviving adults, harvested and returning to spawning grounds and hatcheries, total 2.8 million. About 63 percent of these adults are produced by hatcheries and 37 percent by natural production (Figure ES.1). Because of different levels of smolt production by species, different survival rates from smolt to harvestable adults, and different areas and means of harvest, the total income generated from harvesting is supported by about 70 percent by hatcheries and 30 percent by natural production.
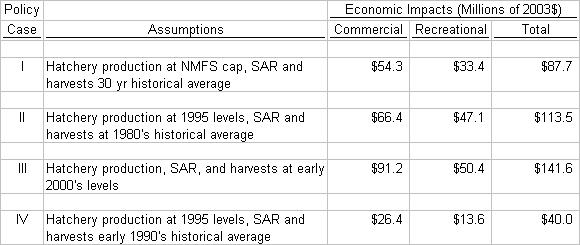
The model to generate estimates of REI uses factors for smolt-to-adult survival rates, hatchery production levels, and harvest regulations. As shown in Table ES.1, the estimates varied from
Figure ES.1. Estimated Hatchery and Wild Smolt Production and Resulting Surviving Adults From the Columbia Basin Using Early 2000's Conditions
$40 million to $142 million, depending on the assumptions for these production and harvest factors. The remainder of this summary focuses on Case III, using factors that describe the conditions representative of the early 2000's.
Figure ES.2 shows how the economic impacts are distributed among geographic areas. About 77 percent of the economic contribution occurs from ocean and in-river fisheries in the Pacific Northwest. Most of the rest occurs in Alaska and British Columbia, with a very small contribution in California as well. Significant economic contributions to Alaska and British Columbia come from fall Chinook. About half of the total economic contribution from fall Chinook is captured outside the Pacific Northwest.
Based on preliminary information of adult survival rates for early 2000's brood stock, the Columbia River Basin anadromous salmonid production will contribute about $142 million total personal income annually to communities on the West Coast. In the Pacific Northwest, a full time equivalent job receives about $30,000 annually. The $109 million generated in the Pacific Northwest states of Washington, Oregon, and Idaho of personal income may support about 3,633 jobs. The total income in the Pacific Northwest states is about $400 billion annually. Although the impact from Columbia Basin salmonid production may be relatively small in comparison, this economic impact can be significant in some local communities with close ties to the fishing industry.
Table ES.1. Economic Impacts Per Year For Four Cases of Columbia River Basin Anadromous Fish Production and Harvest Management
Notes:
- Regional economic impacts are total personal income per year in millions of 2003 dollars.
- Total and subtotals may not equal sum of values due to rounding.
- SAR is smolt-to-adult survival rate. Adults are harvests and returns to hatcheries for hatchery origin anadromous fish. Adults are harvests and spawners plus in-stream prespawning mortality for wild origin anadromous fish.
- Commercial includes ocean treaty and non-treaty harvests from California to Alaska, in-river treaty and non-treaty harvests, and hatchery surplus sales. Recreational includes ocean, in-river mainstem, and in-river tributary.
- The concern about certain species or sub-species of salmon, and the overall effect of hatchery fish on survival of these species, has led to the NMFS placing a cap of 197 million annual smolt releases within the Columbia Basin.
Under early 2000's conditions, about 63 percent of the total economic contribution was generated by the Columbia in-river fishery. Steelhead and spring/summer Chinook are mostly caught in the river. Coho and fall Chinook are mostly caught in the ocean fisheries. Figure ES.3 shows how the four species groups contribute to the economic impact of salmon and steelhead harvest. Although there are only slightly fewer spring/summer Chinook harvested than coho, the higher value of spring/summer Chinook results in a much larger economic impact. The high per fish value of spring/summer Chinook results in them having a higher share of the total economic impact, even though fall Chinook are two-thirds more numerous. Steelhead comprise the smallest number harvested, but they have a high recreational per fish value.
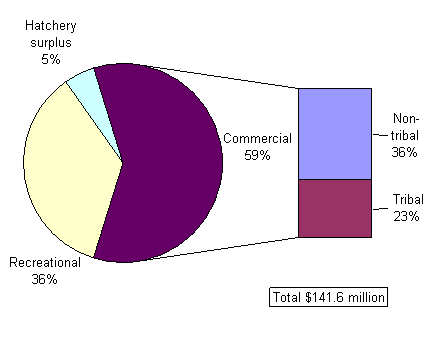
Figure ES.4 shows the relative economic contribution of recreational fishing, commercial fishing and hatchery surplus. Commercial fishing accounts for 59 percent of the economic impact of fishing. Recreational fishing contributes about 36 percent of the total personal income related to salmon and steelhead harvest. Steelhead harvest is largely an in-river recreational activity. A large share of the coho contribution occurs in the ocean recreational fishery.
Figure ES.2. Estimated Percent of Total Economic Impacts of Columbia River Basin Salmon and Steelhead by Region of Catch Using Early 2000's Conditions
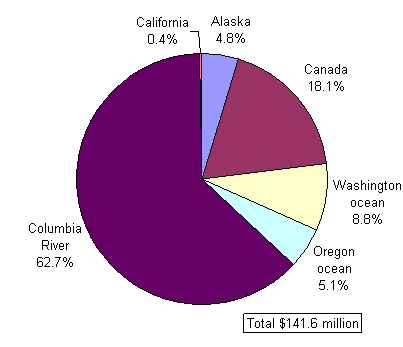
Figure ES.3. Estimated Percent of Total Economic Impacts of Columbia River Basin Salmon and Steelhead by Species Group Using Early 2000's Conditions
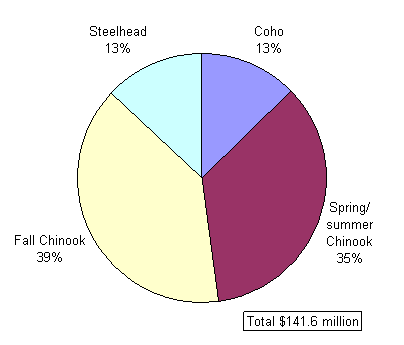
Figure ES.4. Estimated Percent of Total Economic Impacts of Columbia River Basin Salmon and Steelhead by Fishery Types Using Early 2000's Conditions