


Introduction
A utility customer could install a combined Solar-Battery system instead of PV alone or add a battery to an existing PV system. Self-generation from the PV system during the day could be stored in the on-site battery, to be used later in the evening after the sun has set. Behind-the-meter (BTM) Solar-Battery systems could be configured to provide backup power (resiliency) for the home or business, or to lower retail electricity bills by modifying demand during times of high use (if Time-Of-Use rates apply).
The material and installation costs for behind-the-meter solar (PV) has been declining for many years now. It has become more economic for homes and businesses to purchase, install and operate PV systems on-site to generate clean electricity for self-use, and, when possible, sell excess back to the electric grid during periods of high insolation in the mid-day. Now, costs for battery storage are declining as well.
Aggregation of BTM Solar-Battery could also be used holistically to enhance grid operations, such as reducing load during periods of high system stress (peak load). This is the focus of our study – to gauge the potential of BTM Solar-Battery in the Northwest to modify the load on the overall grid.
This work set out to accomplish three primary goals:
- On a high level, determine how aggregated, BTM Solar-Battery systems could be operated to flatten load in the Northwest and smooth out system peaks to avoid relying on costly (and potentially less efficient, carbon-emitting) resources
- Develop functions that quantify the impact of increasing levels of Solar-Battery installations to modify system load
- Implement the load modification functions into Energy2020, the Council’s long-range load forecasting model
Background
Utilities are investigating the potential of behind the meter solar and battery. For example, in 2019, Tucson Electric Power (TEP) announced[1] that they had started a new energy storage pilot program, with the goal of exploring how residential battery storage system could be used to cost effectively reduce electricity demand, especially peak energy and otherwise benefit the grid. Currently, TEP has around 50 customers that have applied for solar + battery systems. The goal is to have a large customer base that can help to shave peak demands and benefit the grid.
Net metering options in Arizona are going away and are being replaced with lower solar export rates (during time of excess). These lower export rates make solar storage systems more attractive. Though battery costs have been declining, battery systems still don’t pencil out financially for a residential customer. Currently the Tesla Powerwall, LG Chem, Sonnen home battery products can run from $10,000 to $15,000[2]. TEP’s goal with their program is to design rates that would make battery systems “accessible and beneficial to customers”. With a new rate program, TEP hopes that “in the future, customers may be able to help with reducing peak load by charging their systems during off-peak hours and deploying during on-peak hours”. Most existing customers with solar + batteries just use the systems for energy backup.
Simulation of Solar-Battery in the Northwest
The Council’s approach takes a “holistic” perspective on the operation of BTM Solar-Battery. A simulation tool was developed that quantifies how aggregated Solar-Battery systems might produce an overall “flattening” of the system load. The simulation steps through a single year - hour by hour - and uses a model of a Solar-Battery system to flatten the peak hourly loads for each day. The main components to the simulation are:
- Hourly solar generation profile – based on the Northwest solar profiles (see Behind the Meter Solar)
- Hourly system load for the Northwest
- Solar-Battery system definition and operation characteristics
- Hourly Solar-Battery operation logic
The primary output is the resulting modified hourly load including measurement of three key load metrics:
- Peak load reduction
- Average load reduction
- Minimum load change (from charging the battery from the grid)
Solar-Battery System
We modeled the Solar-Battery system configuration based on the NREL grid-tiered PV + lithium ion system from their report on residential solar and storage.[3] The Solar-Battery system operational characteristics include:
Solar generation can serve load directly and/or be sent to the battery for storage
- The battery can charge from the grid and/or from the solar system
- The state of charge of the battery is kept within operational limits
- Round trip battery losses are accounted for, as is transmission loss
The following two tables summarize a Solar-Battery system.
Solar-Battery System Definition
| Grid-tiered PV with lithium-ion home battery | PV alone | PV & battery installed together | Battery added to an existing PV system |
| PV capacity | 5.6 kW | 5.6 kW | 5.6 kW |
| Battery energy/capacity | - | 6 kWh / 3 kW | 6 kWh / 3 kW |
| Installed cost $ (2016 dollars) | $15,581 | $27,703 to $29,568 | $32,786 |
Solar-Battery Operation Characteristics
| Battery charging loss | 7 % |
| Battery discharging loss | 7 % |
| Initial battery charge | 25 % |
| Minimum battery level | 10 % |
| Maximum hourly discharge | 50 % |
Operational logic
The simulation runs on a day-by-day basis, starting with the hourly load input and the hourly solar generation potential for a single day. The Solar-Battery system then operates on an hourly basis to flatten that day’s load, particularly the daily peak hourly load. The simulation is run for an entire year and the load results are compiled. Increasing levels of Solar-Battery installations are run through the simulation to develop the functions that relate load reduction to installed capacity levels.
The “load flattening” logic follows:
- Solar generation can serve load directly, or be sent to the battery to store for later use
- The battery can charge from the grid and/or from solar, and discharge to reduce load
- An algorithm attempts to fit the load for each hour into a defined band using the defined Solar-Battery system; the band of load is defined by a load “floor and ceiling”
- The logic will attempt to reduce any hourly load that is over the “ceiling” by dispatching solar and/or battery, and will increase any hourly load that is under the “floor” by charging the battery from the grid
- Multiple combinations of “floor and ceiling” levels are tested, and the combination that results in the lowest hourly peak load is selected
Example
The following data are output from the simulation tool for a single day – January 29 – with installed capacity of 2375 MW of Solar-Battery (in a one-to-one ratio). The figure below shows the load by hour. The load shape is typical of a winter day in the Northwest, with peaks in the morning and evening hours. The Solar-Battery system can be used to shave off both peaks.
Simulation Results for a Single Day in January
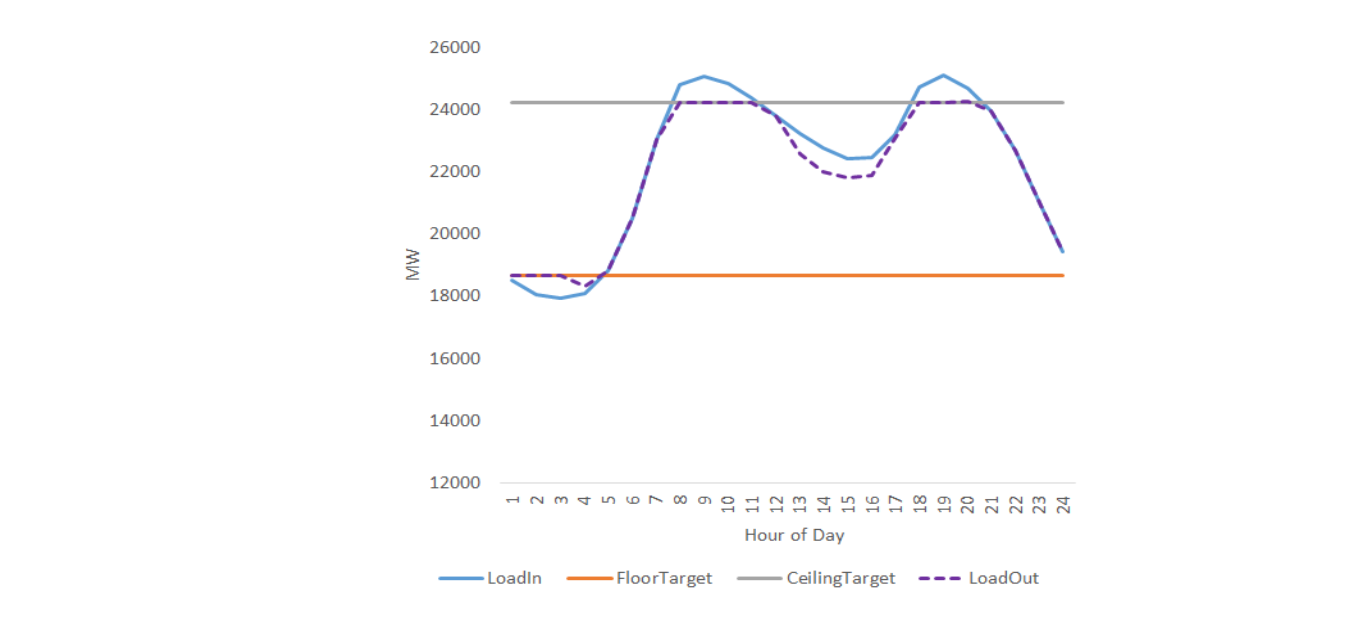
The blue line represents the starting system load. The orange and grey lines are the “floor and ceiling” that define the load band. The purple line shows the resulting modified load after the system was dispatched to fit the load into the desired band.
The next figure shows how the Solar-Battery system was operated to modify the load.
Simulation Results Solar-Battery Operations
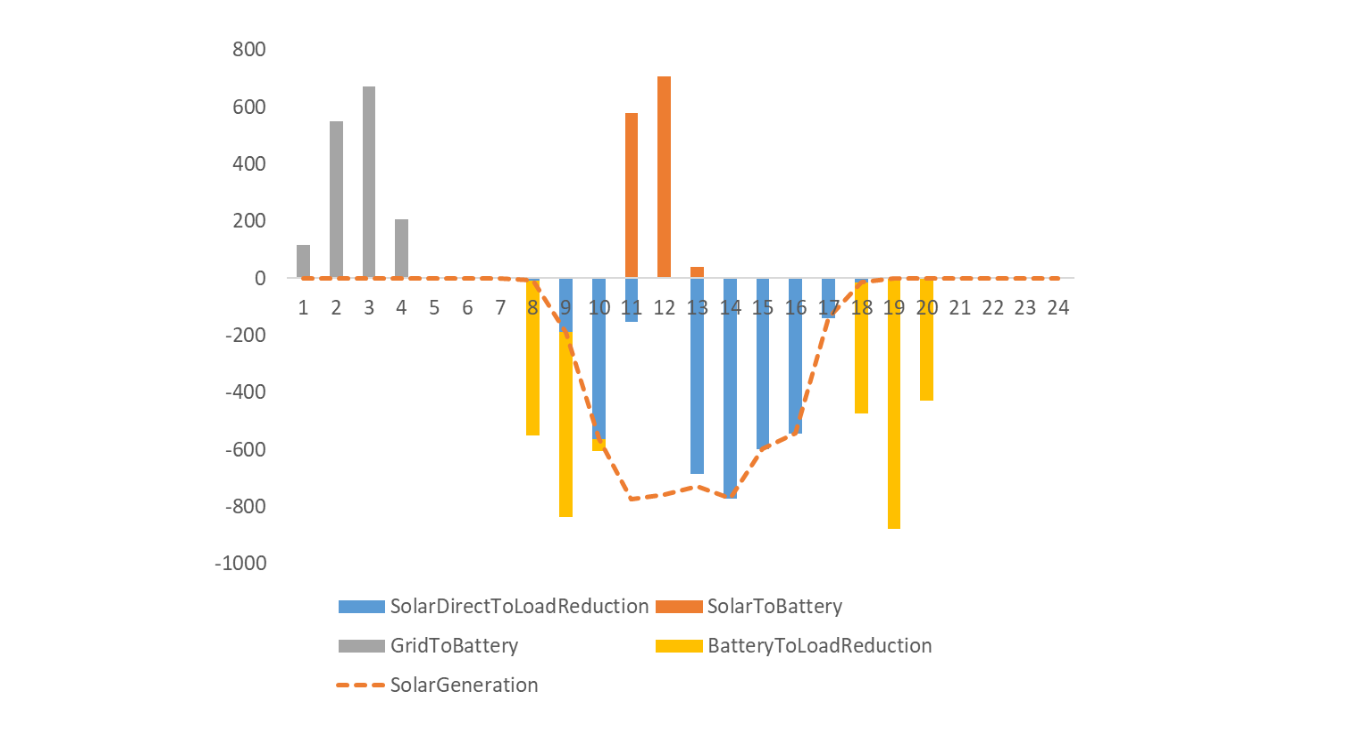
In the early hours, the battery charges from the grid, increasing the overall system load. Then battery is discharged to reduce the morning peak. Once the sun is up and the solar is generating, initially it is used directly to reduce load. Then in the mid-afternoon, the solar re-charges the battery, before being used directly for load again. Then in the evening, the battery is dispatched to shave off the peak.
Results
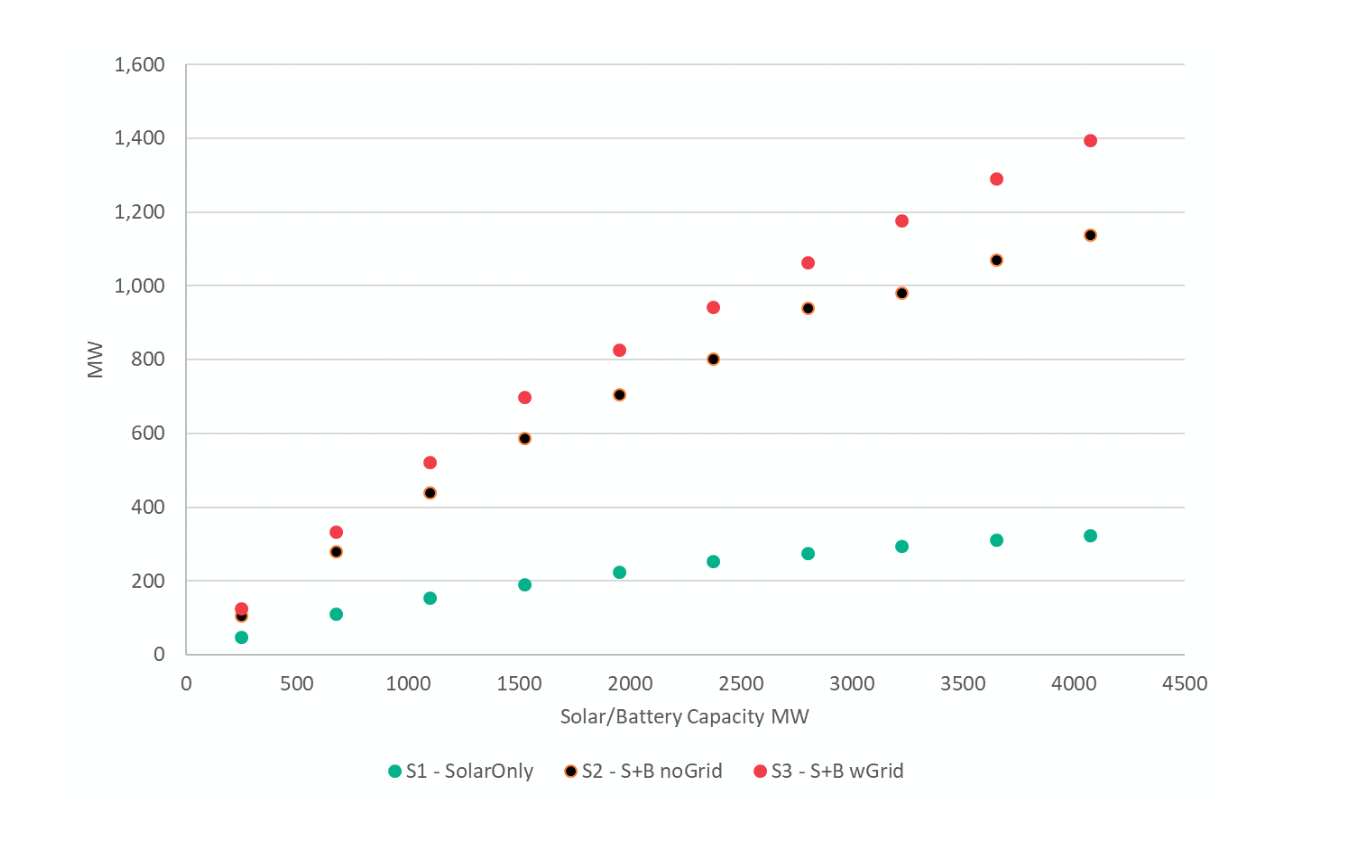
The simulation was setup to run 3 Solar-Battery configurations with increasing levels of installations (from 250 MW to 4075 MW). The battery is assumed to be paired to solar on a 1 MWh to 1 MW basis. The 3 configurations were:
- S1 - solar alone (no battery)
- S2 – Solar-Battery with no grid charging
- S3 – Solar-Battery with grid charging available
The results for peak reduction are show in below. These values are the average daily peak load reduction as a function of installed capacity. The curve for solar alone (S1) quickly levels out, showing how solar doesn’t coincide well with peak load times. By adding a battery, the peak load reductions are dramatically higher.
Simulation Average Daily Peak Load Reduction by Installed Capacity
The amount of peak load reduction varies from month to month. The next figure shows the average daily peak load reduction by month for a specific case (6) of Solar-Battery installations (2375 MW).
Simulation Average Daily Peak Load Reduction by Month
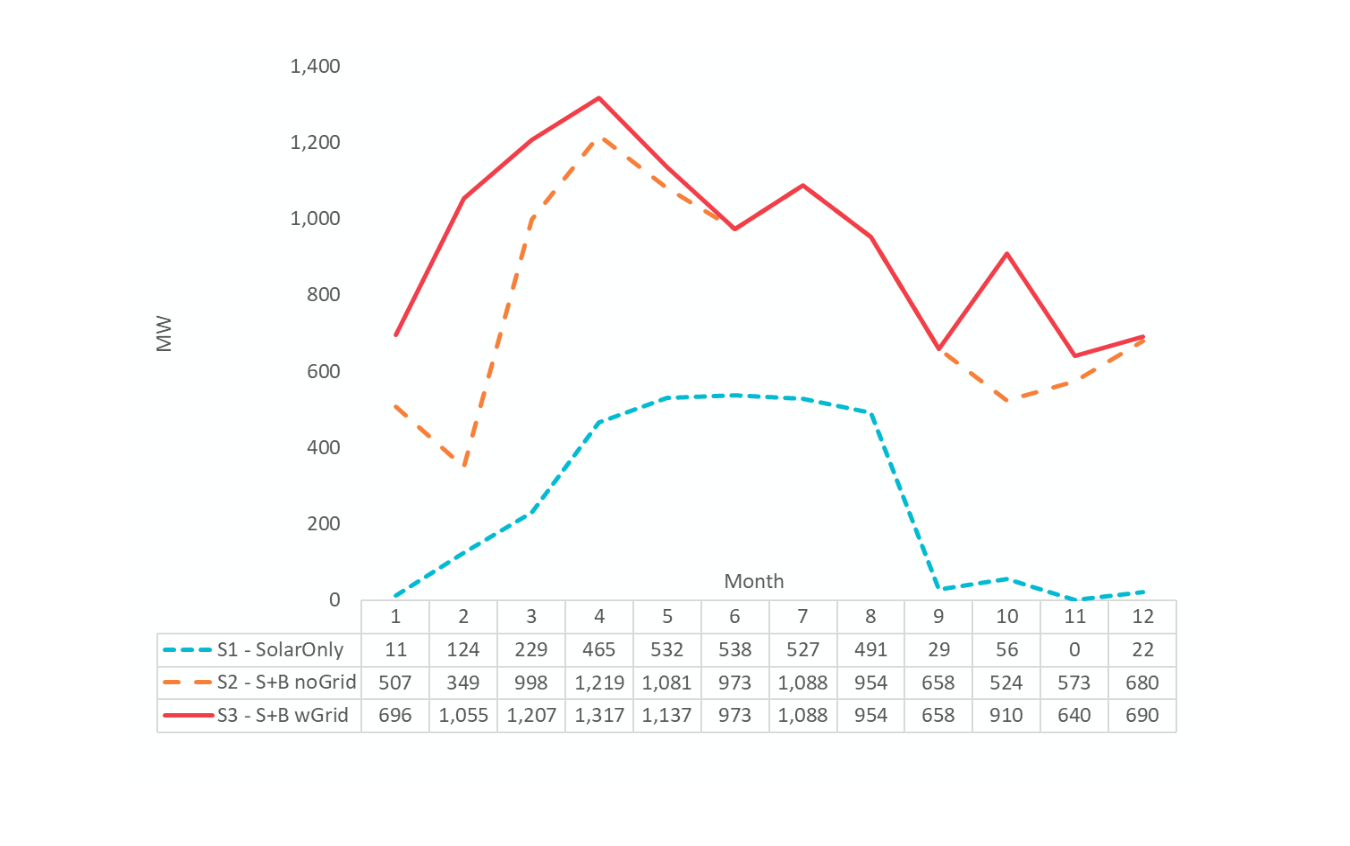
The solar alone (S1) configuration does not help with the winter or fall peaks. Adding a battery, but only charging from solar improves peak reduction significantly. Allowing grid charging of the battery significantly helps in the winter months by allowing the battery to charge in the middle of night in order to help shave the morning peak.
In order to implement the simulation results into our load forecasting model Energy2020, we developed functions that relate the amount of load reduction to the installed solar + battery capacity level and unmodified load, on a monthly basis.
Peak Load Function:
PR = peak reduction
BIC = solar + battery capacity installed
P = peak load in
a,b = monthly parameters
This allows for a quick estimate of the impact of the peak load reduction that installed Solar-Battery systems could provide. The table below shows the parameters and calculations for peak load reduction with using 1,200 MW/MWh of Solar-Battery
Peak Load Reduction Calculation
| Month | a | b | Installed Capacity MW/MWh – Solar + Battery | Daily Peak Load - Unmodified | Daily Peak Load Reduction |
| 1 | -0.03728 | 0.22423 | 1,200 | 26,100 | 407 |
| 2 | -0.02446 | 0.37614 | 1,200 | 24,888 | 540 |
| 3 | -0.04851 | 0.38088 | 1,200 | 23,469 | 630 |
| 4 | -0.05936 | 0.42369 | 1,200 | 21,760 | 715 |
| 5 | -0.16184 | 0.13445 | 1,200 | 20,408 | 712 |
| 6 | -0.14379 | 0.09460 | 1,200 | 21,452 | 611 |
| 7 | -0.04640 | 0.32716 | 1,200 | 23,101 | 557 |
| 8 | -0.08047 | 0.22254 | 1,200 | 22,268 | 549 |
| 9 | -0.04543 | 0.19564 | 1,200 | 20,584 | 390 |
| 10 | -0.06669 | 0.21985 | 1,200 | 21,147 | 493 |
| 11 | -0.02932 | 0.22726 | 1,200 | 23,904 | 378 |
| 12 | -0.02456 | 0.23857 | 1,200 | 26,289 | 377 |
A Few Takeaways
Installing both solar and a battery together and allowing grid charging can help to reduce system peaks much more effectively than solar alone.
The shape of the input load and the solar profile have a big influence now how the system is dispatched and how effective the system is at modifying load
Early May has a distinct morning peak load hour, coincident with good solar generation
September has relatively flat input load – results in limited battery usage and less single hour peak reduction
January has two distinct peak load hours and limited solar generation – results in significant battery usage and grid charging
[1] https://tucson.com/business/tucson-electric-power-customers-may-see-new-rate-for-energy/article_b7291baa-f4f5-5efa-b6e2-dba95f1a5075.html
[2] https://news.energysage.com/lg-chem-resu-battery-review/
[3] Installed Cost Benchmarks and Deployment Barriers for Residential Solar Photovoltaics with Energy Storage: Q1 2016 https://www.nrel.gov/docs/fy17osti/67474.pdf