


The Council was formed in part because simple historic-trend forecasts for the regions use of electricity had substantially overstated the future needs. In the late 70s and early 80s, the region was beginning to see some slowing of its historically rapid growth of electricity use, and it began to question the future of several proposed nuclear and coal generating plants. The Northwest Power Act tasked the Council with including a “demand forecast of at least twenty years” in the Power Plan. This was to be used in evaluating what resources would best meet the regional needs. The act also puts a strong emphasis on conservation as a resource. So, the demand forecast needs to support a detailed evaluation of conservation-based resources like energy efficiency.
To forecast future energy use, the Council uses a system that incorporates end-use details of each consuming sector (residential, commercial, industrial, agriculture, transportation, etc.) These models require detailed separate economic forecasts for each sector as well as forecasts of climatic and demographic trends, electricity prices, and fuel prices. But just understanding how much energy is needed is not enough. We also need to forecast when electricity is used to make sure the system has sufficient resources to meet the peak electricity need. That is the Council needs to understand the pattern of electricity demand over seasons, months, and hours of the day.
While the Council is tasked with forecasting the regional need for energy, we also have a responsibility to make recommendations on the amount of resource required to meet that need. But since deregulation of the Western electricity markets, how much electricity we anticipate being available for purchase from entities other than regional utilities becomes an important component of those recommendations. To aid in that evaluation we also forecast the electricity needs outside our region in the rest of the Western Interconnection.
Range of Forecast Electricity Use
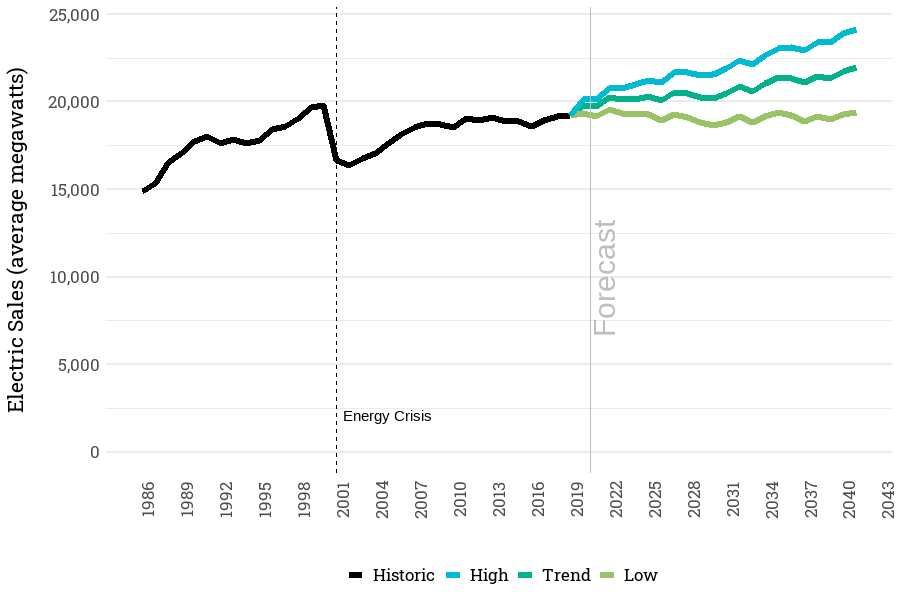
The Council’s Plan predicts electricity load to grow from about 20,986 average megawatts in 2018 to between 22,000-26,000 average megawatts by 2041 and 29,000 average megawatts by 2050. On average annual basis, between 2022 and 2050, regional electricity loads are forecast 0.1 - 0.8%. This level of growth does not take into account expected load reductions due to new conservation measures. Forecast load includes the impact of climate-change-based temperatures. Details on the projected Cooling Degree Days and Heating Degree Days for the forecast period are available here.
Range of Load Forecasts – Prior to Conservation

Electricity Use by Sector
The residential sector is forecast to have increasing demand for electricity. The commercial sector’s demand is expected to be flatter. The industrial sector includes all standard industrial segments plus the direct service industries (DSIs), agriculture including cannabis production, and large standalone data centers. The transportation sector includes loads from public transport sector as well as load from electric vehicles, both hybrid and all electric. As anticipated the overall average annual load growth rates are modest at best (the growth rates shown are prior to netting of energy efficiency).
Electricity Use by Sub-region
The Council’s electricity use forecast can be broken down into state-level forecasts. Our forecast is also formulated to allow for breaking out the electricity demand forecast to be met by the Bonneville Power Administration.
Electricity Sales Forecast
The load forecast is at the generator busbar, in other words, it includes transmission and distribution losses. This energy loss from transmission and distribution varies depending on temperature conditions and the mix of sectors. Higher temperatures coincident with higher loads mean a greater loss of energy. Transmission and distribution losses also increase as the regional load shifts to the residential or commercial sector. Large industrial customers like the Direct Service Industries receive power at the transmission level and have lower losses because they don’t have the additional local distribution system losses.
The Council’s load forecast incorporates anticipated improvements in the Transmission and Distribution losses over the forecast period, due to technical improvements in efficiency of distribution transformers. Average annual transmission and distribution losses from 1988-2013 have averaged about 13 percent. It more recent years, the T&D losses have been in decline, in part due to better measurement of sales. In the forecast horizon 2022-2050, T&D losses are assumed to decline to about 5 percent.
Regional Sales Forecast
Details on the electricity sales by sector are available here.