


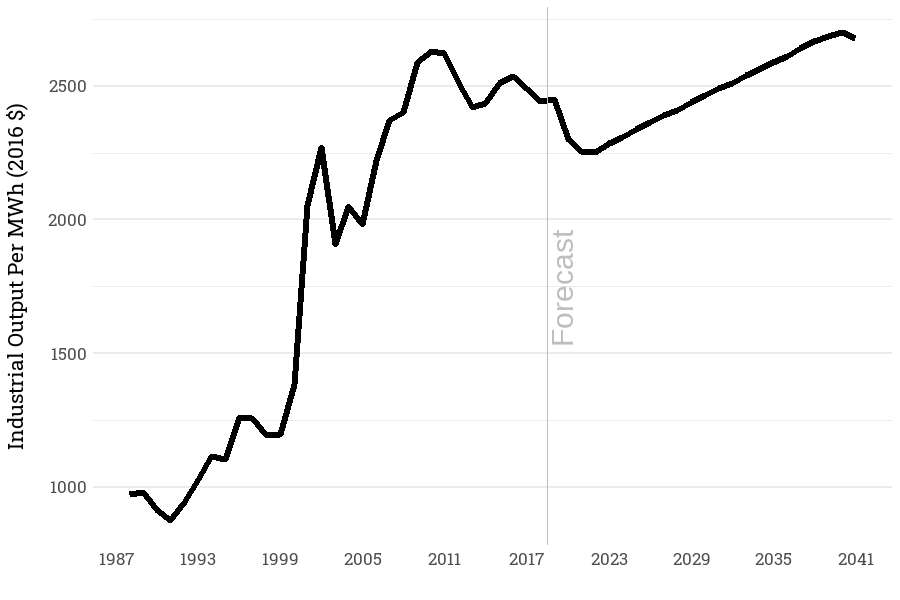
Demand for energy in the industrial sector is driven by the demand for goods and products produced in the region. Historically, demand for electricity in the industrial sector was dominated by a few large energy-intensive industries. However, the regional mix of industries has been changing away from industries that use large amounts of electricity in manufacturing commodities or lower-value products and toward industries with higher value-added products that use less electricity in manufacturing. During the 1980s and 1990s, industries in the Northwest used significantly more energy for every dollar of output they produced. Post 2000 we see significant jump in industrial output per unit of energy. This was at least in part due to the closure of large aluminum smelters during the West Coast Energy Crisis.
Regional Industrial Output Electricity Use Intensity
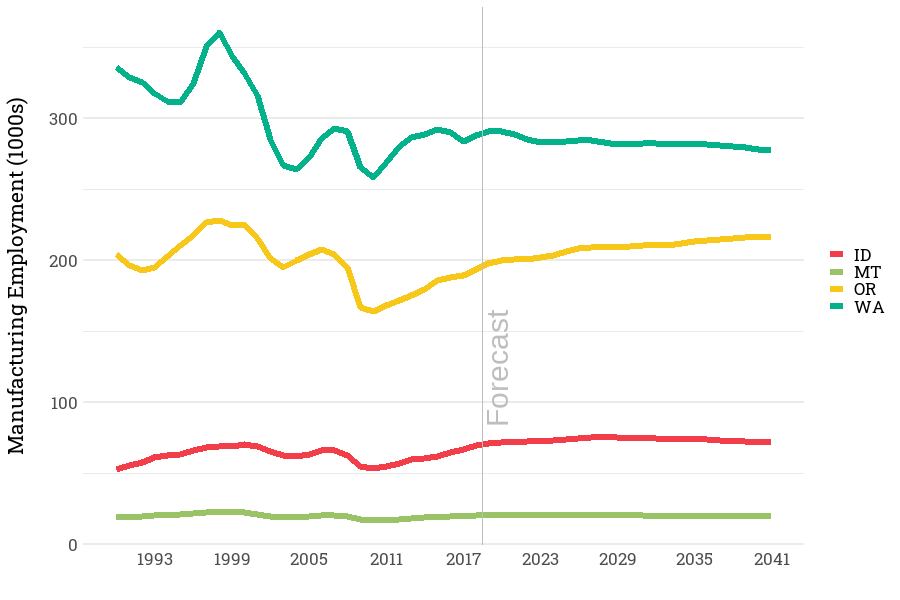
In the Seventh Power Plan, we had used manufacturing employment as the key driver for demand for energy. After completion of the Seventh Power Plan, the Council undertook a revamping of its manufacturing sector forecast. Council staff benchmarked electricity consumption by sector and state. For the 2021 Power Plan, economic drivers of manufacturing sectors include trajectory of growth in output or employment depending on the sector.
Forecast of Industrial Employment
The demand forecast model tracks distinct industries. Industrial employment has been on the decline, thus the 2021 Plan forecast for manufacturing employment is rather flat. For 2020 through 2050 manufacturing employment is projected to remain at around 582,000 to 586,000 employees.
Industrial employment peaked at about 650,000 in 2000. During the 2000-2010 period, manufacturing employment declined to 560,000. During the Action Plan period, manufacturing employment is projected to pick up to about 580,000 employees.
Manufacturing Employment by State
Forecast of Industrial Manufacturing Output
State level industrial output is forecasted using Global Insight’s product Business Markets Insight. The 4 to 6-digit NAICS code forecasts were used to identify fast growing industries. In terms of output from manufacturing sector, current forecast shows significant increase. Manufacturing output in constant 2005 dollars, increased from 26 billion dollars in 1985 to 119 billion dollars by 2017. During the Action Plan period, manufacturing output is expected to increase from 131 to 153 billion dollars and by 2040 output from manufacturing sectors are expected to reach over 230 billion dollars. The following figure shows the historic and forecasted output by state.
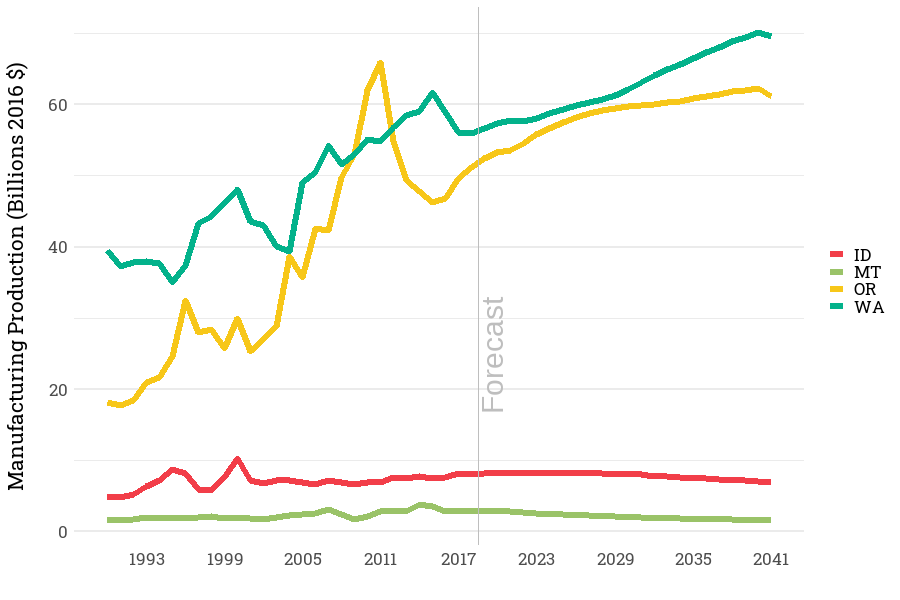
The demand for energy consumed in each industry is forecast using the estimated growth in the product output in that industry. Output in each industry starts with forecast from Global Insight, then it is modified based on feedback from Demand Forecast Advisory Committee. Following table reflects average annual growth rate for manufacturing in the historic, Action Plan period, and long-term.
Average Annual Growth Rate Manufacturing Output in Constant 2016 dollars
| 1985-2017 | 2022-2027 | 2022-2041 | |
| Idaho | 2.2% | -0.2% | -1.0% |
| Montana | 1.8% | -3.5% | -2.9% |
| Oregon | 3.5% | 1.5% | 0.6% |
| Washington | 2.1% | 0.9% | 1.0% |
| Region | 2.6% | 1.0% | 0.7% |
The composition of industrial output is also forecast to change. Manufacturing facilities producing food, rubber, paper, transportation, and chemicals are forecasted to grow. Regional manufacturing output by sector for both the historic observed and forecast values can be viewed here.