


This section contains descriptions of the two R-scripts that transform outputs from the classic GENESYS into input files for AURORA.
GENESYS Hydro-Generation Output for AURORA Capacity Factors
This section describes transformation of the classic GENESYS output for hydro-generation into monthly and annual capacity factors for input into AURORA.
The classic GENESYS models operations of the Northwest power system, and for the operating year 2031, an example hourly resources dispatched to meet the Northwest regional load (see classic GENESYS section for more details) is presented below.

A portion of an example classic GENESYS output of hourly resource dispatched to serve the Northwest regional load.
The relevant data in the figure above more easily explained after being formatted by an R-script which results in the figure below.

Formatted data relevant to hydro generation
The first column “Operating Year” indicates the year, 2031, in which operations of the Northwest power system are being simulated. The second column “Water Year” specifies the associated streamflows, operating rule-curves and constraints data for the listed water-year are used to simulate operations of the Northwest regulated hydro-projects. For this example, 30 water-years for climate scenario C, from 2020 to 2049, are simulated (see summary of climate change scenarios for more details). The third to fifth columns are respectively the months, days and hours of the water-year listed in the second column. Finally, the sixth column is the hydro-generation, in MW, dispatched to serve the Northwest regional load. Since 30 water-years are simulated, then there are 30×8,760=262,800 rows of hourly data (leap days are not included), of which the first 18 rows are shown above.
However, according to the classic GENESYS algorithm, there are also some hours where hydro-generation along with the required must-run resources such as wind, solar, net import power contracts and the must-run thermal resources (a subset of the total thermal resources) exceed the regional load. For those hours, the left-over portion of the hydro-generation that is not dispatched to serve load is designated as “Excess Hydro” and its data are exported to an over-generation output file. After being formatted by the same R-script, a portion of the over-generation data is presented in the figure below.

Formatted over-generation data
For this example, that models the 2031 Northwest power system operations running with climate data from 30 water-years of climate scenario C, there are 34,590 hours, which is about 13% of the 262,800 total simulation hours, for which there are excess hydro generation. The excess hydro generations, in MW, are listed in column F above.
The R-script then merges the formatted dispatched hydro-generation data and the formatted excess hydro-generation data above and sums both types of hydro-generation to result in the total hydro generation. The result is presented in the figure below.

Merged Dispatched (column F) and Excess (column G) Hydro-generation Data and their Sum (column H).
In the figure above, the total hydro-generation, listed in column H, is a sum of the dispatched hydro-generation in column F and the excess hydro-generation in column G. It could be seen that for Hours 1 to 5 on November 2, water-year 2020, the non-zero excess hydro-generation are added to the dispatched hydro generation.
For each of the 30 simulated water-years from 2020 to 2049, an annual capacity factor is calculated as the ratio between the annual average of the total hydro-generation (column H from the figure above) and the Northwest hydro-generation capacity, which is approximately 34,086 MW. The R-script performs this calculation and formats the data as inputs into AURORA. A portion of the results is presented below.

A section of the AURORA input file for the annual hydro-generation capacity factors calculated from the classic GENESYS total hydro-generation
In the figure above, Game1 in columns A and B refers to the first water-year from the total hydro generation table, which is 2020. Subsequent water-years, for example 2021, …, 2049, are incremented accordingly as Game2, …, Game30. Finally, the annual hydro-generation capacity factors for operating year 2031 are listed under column X with column name 2031.
Finally for each month in each of the 30 simulated water-years from 2020 to 2049, a monthly capacity factor could be calculated from the total hydro generation as the ratio between the monthly average and the annual average. The same R-script also performs this calculation and formats the results as inputs into AURORA and a portion of which is shown in the figure below.
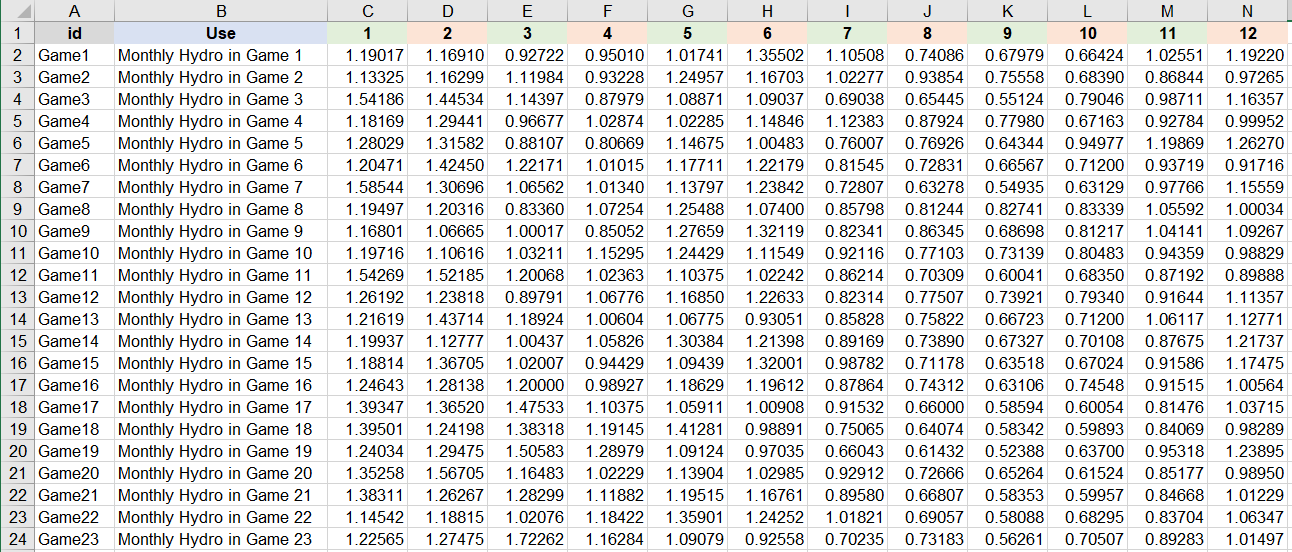
A section of the AURORA input file for the monthly hydro-generation capacity factors calculated from the classic GENESYS total hydro-generation
In Figure 6, GameN’s in columns A and B also refer to the simulated water-years, as similarly discussed previously. For examples, Game1 represents water-year 2020 and Game30 represents water-year 2049. Furthermore, the monthly hydro-generation capacity factors are listed along column C to column N where column name 1 represents January and column name 12 represents December.
GENESYS Hydro-Generation Output for AURORA Daily Limits
This section describes transformation of the classic GENESYS output for hydro-generation into daily maximum and minimum capacity factors for inputs into AURORA.
From the previous section, an R-script transformed and formatted the classic GENESYS dispatched and excess hydro-generation output data for an example simulation run for the 2031 Northwest power system using 30 water-years from climate scenario C, resulting in Figure 4. In Figure 4, the total hourly hydro-generations listed in column H are then used to calculate the daily maximum and minimum capacity factors. More specifically, for each day (columns C and D) in each of the 30 simulated water-years from 2020 to 2049 (column B), the daily maximum capacity factor is the ratio between the maximum total hydro-generation for the 24 hours and the Northwest hydro-generation capacity, which is approximately 34,086 MW. Similarly, the daily minimum capacity factor is the ratio between the minimum total hydro-generation for the 24 hours and 34,086 MW. An R-script performs the statistical calculations and formats the results for inputs into AURORA, a portion of which is presented in the figure below.

A section of the AURORA input file for the daily maximum and minimum hydro-generation capacity factors calculated from the classic GENESYS total hydro-generation
In the table above, column A identifies the daily maximum and minimum capacity factors. Column B lists the 365 days for the operating year 2031; one set of 365 days on top for the daily maximum capacity factor and another set below for the daily minimum capacity factor. Column C lists the 24 hours of the day in column B. Finally, the next 30 columns, F to AI (not shown above), are values for the daily maximum and minimum capacity factors for the 30 water-years respectively, where column name Game1 represents water-year 2020, and column name Game2 represents water-year 2021, etc.