


Overview
For the 2021 Power Plan, the Council chose to use climate data developed by the River Management Joint Operating Committee (RMJOC). A comprehensive report on the RMJOC climate data is available in RMJOC Report I. In the report, RMJOC staff selected 19 climate scenarios for reservoir regulation studies in order to model and analyze climate impacts on hydro power, flood risk management, water supply, ecosystem and biological operations, among other topics of interest. Results of the hydro-regulation studies are published in RMJOC Report II. To ensure a timely completion of the Power Plan, the Council selected a representative subset of the 19 RMJOC climate scenarios for study as documented in climate scenario selection. Since data from the selected RMJOC climate scenarios are inputs into many of the Council’s models used for the Power Plan (see incorporating climate data in the Power Plan for more details), this section is a summary of the climate scenarios from RMJOC Report I.
Global Climate Models Selected by the RMJOC
Climate scientists at Oregon State University and the University of Washington, in collaboration with RMJOC staff, selected ten global climate models (GCMs) from the Coupled Model Intercomparison Project Phase 5 (CMIP5) that better replicate historical climate data for the Pacific Northwest region and the larger western North America and northeast Pacific. The ten selected GCMs are listed in Table 1.
Table 1: The ten Global Climate Models selected by the RMJOC
| 1. CanESM2 | 6. HadGEM2-CC |
| 2. CCSM4 | 7. HadGEM2-ES |
| 3. CNRM-CM5 | 8. inmcm4 |
| 4. CSIRO-Mk3-6-0 | 9. IPSL-CM5-MR |
| 5. GFDL-ESM2M | 10. MIROC5 |
For each of the ten GCMs, data are available for several representative concentration pathways (RCPs). The RCP is in units of watts per square meter and represents the difference in energy flux radiated by the atmosphere back to the surface between the year 2100 and the chosen pre-industrial year of 1765 For example, for GCMs with RCP8.5, the atmosphere for the year 2100 will radiate to the surface with 8.5 W/m2 more energy flux than it did for the year 1750. This increase in energy radiated on the surface of the earth, or positive radiative forcing, would lead to higher warming for 2100 relative to 1750. Furthermore, it has been calculated that relative to 1765, radiative forcings for 1950, 1980 and 2011 were 0.57 W/m2, 1.25 W/m2 and 2.29 W/m2 respectively (see IPCC AR5 WG1 Figure SPM.5). Thus, the positive radiative forcing has been increasing over the recent decades and so has warming. The RMJOC selected GCMs with RCP4.5 and RCP8.5.
Up to the time of , greenhouse gas emissions most closely followed those consistent with RCP8.5 radiative forcing. Since then, there has been debate about the plausibility of RCP8.5 over the long term (Hausfather and Peters 2020) but RCP8.5 is still considered a likely scenario and appropriate for planning purposes out to at least 2050 (Shwalm et al. 2020), which is the time horizon of this study. Moreover, for the Columbia River basin there is a large overlap in regional GCM projections of temperature and precipitation from RCP4.5 and RCP8.5 to 2050 (Rupp et al., 2017). Therefore, Council staff decided to use only GCMs with RCP8.5 for the Power Plan, matching the RMJOC decision to also choose the RCP8.5 GCMs for its hydro-regulation studies.
The ten selected CMIP5 GCMs have spatial grids with resolutions between 47 miles to 186 miles. Grids with these distances are too coarse to adequately capture the complex terrain and highly varied climate across the Columbia River Basin. Also, the spatial grids might not lie on locations of interests such as the airports of the four Northwest cities, Seattle, Portland, Spokane, and Boise, where their temperature data are used in the Council’s load forecast models. Therefore, to make the climate data more useful, the RMJOC transformed the coarse grids into finer grid size of about 4 miles by 4 miles using two statistical methods: the Bias-Corrected Spatial Disaggregation (BCSD) downscaling and Multivariate Adaptive Constructed Analog (MACA) downscaling.
Furthermore, climate scientists collaborating with the RMJOC discovered that the CMIP5 GCMs, on average, have a cold bias over the northwestern US relative to historical observations. The bias is largest in the months of February through May[1]. Thus, to alleviate the impacts of this temperature bias on the hydrological and power system modeling, bias correction steps were included in the two statistical downscaling methods used to generate the temperature and precipitation data on the finer spatial grids. See https://www.climatologylab.org/maca.html for more details.
With the two downscaling methods, RMJOC staff were able to calculate for the ten GCMs downscaled temperature and precipitation data on many grid points over the Columbia River Basin. Because of using two downscaling methods, the original 10 CMIP5 GCMs in Table 1 become 20 downscaled GCMs and listed in Table 2.
Table 2: The 20 RMJOC downscaled Global Climate Models. The downscaling method is specified in either blue or red color.
| CanESM2_BCSD | CanESM2_MACA | HadGEM2-CC_BCSD | HadGEM2-CC_MACA |
| CCSM4_BCSD | CCSM4_MACA | HadGEM2-ES_BCSD | HadGEM2-ES_MACA |
| CNRM-CM5_BCSD | CNRM-CM5_MACA | inmcm4_BCSD | inmcm4_MACA |
| CSIRO-Mk3-6-0_BCSD | CSIRO-Mk3-6-0_MACA | IPSL-CM5-MR_BCSD | IPSL-CM5-MR_MACA |
| GFDL-ESM2M_BCSD | GFDL-ESM2M_MACA | MIROC5_BCSD | MIROC5_MACA |
The climate data (precipitation and temperature) from the 20 downscaled GCMs in Table 2 were used with hydrological models to generate natural streamflow data. It should be noted that these natural streamflows do not take into account any irrigation, evaporation, or regulation from hydro-projects. RMJOC staff used four hydrological models: the Variable Infiltration Capacity (VIC) Model developed at the University of Washington (VIC-P1), at the Oak Ridge National Laboratory (VIC-P2), and at the National Center for Atmospheric Research (VIC-P3), and the Precipitation Runoff Modeling System (PRMS-P1) Model.
Thus, the four hydrological models produced 80 climate scenarios of natural streamflows from the 20 downscaled GCMs in Table 2. Since it is not practical to list all 80 scenarios in a table, an example is presented for one downscaled GCM to show the transformation of its climate data into climate scenario streamflows. The downscaled CanESM2_BCSD model in Table 2 will produce four scenarios: CanESM2_BCSD_VIC_P1, CanESM2_BCSD_VIC_P2, CanESM2_BCSD_VIC_P3, and CanESM2_BCSD_ PRMS_P1, where the hydrological models are printed in orange font. These four scenarios have different streamflows but the same temperature since hydrological modeling does not affect temperature. Therefore, even though there are 80 scenarios for climate-data based natural streamflows, there are only 20 unique scenarios for climate-data based temperatures.
RMJOC staff performed extensive analyses of the 80 climate scenarios and the following are excerpts from the executive summary in RMJOC Report I:
- Temperatures have already warmed about 1.5°F in the region since the 1970s. They are expected to warm another 1 to 4°F by the 2030s.
- Temperatures are likely to warm 3 to 6°F over what is currently observed in the basin by the 2070s if RCP4.5 emissions pathways are attained. If current trajectory RCP8.5 emissions pathways are realized, though, 4 to 10°F of warming above what is currently observed will be likely by the 2070s.
- Warming is likely to be greatest in the interior, with a greater range of possible outcomes, with less pronounced warming near the coast.
- Future precipitation trends are more uncertain, but a general upward trend is likely for the rest of the 21st century, particularly in the winter months. Already dry summer months could become drier.
- Average winter snowpacks are very likely to decline over time as more winter precipitation falls as rain instead of snow, especially in the US side of the Columbia Basin.
- By the 2030s (which refers to the middle decade of the near-future 30 years, from 2020 to 2049), higher average fall and winter flows, earlier peak spring runoff, and longer periods of low summer flows are very likely. The earliest and greatest streamflow changes are likely to occur in the Snake River Basin, although that is also the basin with the greatest modeling and forecast uncertainty.
- In the Willamette Basin, fall and winter flows are likely to increase. A slight decrease in spring flows is possible, with a longer period of low summer flows more likely than not.
The 19 RMJOC Climate Scenarios
Because a hydro-regulation study for just one scenario requires considerable time and resources to complete, RMJOC staff decided to study hydro-regulation for only a representative subset of the 80 scenarios. The representative subset of 19 climate scenarios is listed in Table 3.
Table 3: The 19 climate scenarios selected by the RMJOC for hydro-regulation studies. The GCM and RCP8.5 are in black font, with the downscaling method in green, and hydrological model in orange.
| A: CanESM2_RCP85_BCSD_VIC_P1 | K: GFDL_ESM2M_RCP85_MACA_VIC_P2 |
| B: CanESM2_RCP85_MACA_PRMS_P1 | L: HadGEM2-CC_RCP85_BCSD_VIC_P1 |
| C: CCSM4_RCP85_BCSD_VIC_P1 | M: HadGEM2-CC_RCP85_MACA_VIC_P1 |
| D: CCSM4_RCP85_MACA_VIC_P3 | N: inmcm4_RCP85_BCSD_PRMS_P1 |
| E: CNRM-CM5_RCP85_BCSD_VIC_P2 | O: inmcm4_RCP85_BCSD_VIC_P2 |
| F: CNRM-CM5_RCP85_MACA_VIC_P1 | P: inmcm4_RCP85_MACA_VIC_P3 |
| G: CNRM-CM5_RCP85_MACA_VIC_P3 | Q: IPSL-CM5A-MR_RCP85_MACA_VIC_P2 |
| H: CSIRO-Mk3-6-0_RCP85_BCSD_PRMS_P1 | R: MIROC5_RCP85_BCSD_PRMS_P1 |
| I: GFDL_ESM2M_RCP85_BCSD_VIC_P2 | S: MIROC5_RCP85_BCSD_VIC_P3 |
| J: GFDL_ESM2M_RCP85_MACA_VIC_P1 |
These 19 scenarios were selected by the RMJOC to cover a wide range of differences in hydrological conditions between the 2030’s time period (the 30 years from 2020 to 2049) and a historical period (the 30 years from 1976 to 2005) for 14 hydro-projects throughout the Columbia River Basin. A map of the 14 hydro-projects, designated by open black circles with their RMJOC abbreviations listed in white rectangles, was presented in Figure 76 in RMJOC Report I, which is copied below.
Figure 1: A copy of Figure 76 in RMJOC Report I that shows a map of the 14 hydro-projects, highlighted in open black circles with RMJOC abbreviations inside white rectangles, whose streamflow metrics were used to select the 19 RMJOC climate scenarios.
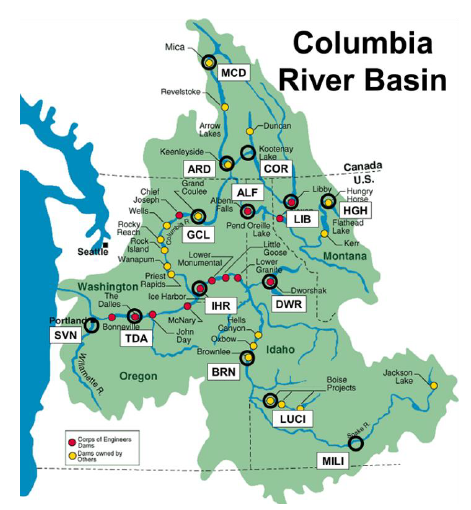
The 14 hydro-projects and their RMJOC abbreviations are Mica (MCD), Arrow (ARD), and Cora Lynn (COR) in Canada, and Hungry Horse (HGH), Libby (LIB), Albeni Falls (ALF), Grand Coulee (GCL), Dworshak (DWR), Ice Harbor (IHR), The Dalles (TDA), T. W. Sullivan (SVN), Brownlee (BRN), Lucky Peak (LUCI), and Milner (MILI) in the United States. The hydrological conditions are characterized by six streamflow metrics: river-flow volume for the entire year and for the winter, spring and summer periods, winter-to-spring volume ratio, and annual half-volume timing (which is the date on which half the annual volume at The Dalles has passed). RMJOC staff then developed an algorithm based on the six streamflow metrics for the 14 hydro-projects to select the 19 out of 80 climate scenarios. More details are available in the RMJOC Report I.
For the representative 19 climate scenarios, RMJOC staff performed hydro-regulation studies and published the results and analyses in RMJOC Report II. The RMJOC shared these data with the Council, which include modified streamflows (which do contain effects of irrigation and evaporation, but not regulation from hydro projects), flood-control and refill rule-curves, and hydroelectric system operating constraints. These hydro data are needed for the Council’s resource adequacy model, the redeveloped GENESYS. For simplicity, the adequacy model will be subsequently referenced as GENESYS. In addition, the RMJOC also shared temperature data at Seattle, Portland, Spokane, and Boise needed for the Council’s load forecast model for all 19 scenarios. Other GENESYS input data such as wind and solar generation are unfortunately not available from the RMJOC. Thus, a method was developed to calculate wind generation from climate wind data available at the Climatology Lab at the University of California, Merced. This process is documented in climate wind generation write-up. For climate solar generation, Council staff decided to use historical solar data, on which a discussion is presented in incorporating climate data in the Power Plan. Details of the GENESYS model are available in GENESYS write-up.
Since the full designation for each of the 19 climate scenarios in Table 3 is quite long, for convenience, in subsequent sections the scenarios are referenced by the assigned alphabetical indices, from A to S, which are printed in bold blue font. It should be noted that the pair of scenarios in each of the four sets, (F, G), (J, K), (N, O) and (R, S), have the same climate temperature since they come from the same GCM and are calculated with the same downscaling method but differ in the hydrological models used. Because of duplications in temperatures in these four pairs of scenarios, there are only 15 unique scenarios for climate temperatures in contrast to the 19 unique scenarios for climate streamflows.
Hausfather, Z., & Peters, G. P. (2020). Emissions - the "business as usual" story is misleading. Nature, 577(7792), 618-620. https://doi.org/10.1038/d41586-020-00177-3
Rupp, D. E., Abatzoglou, J. T., & Mote, P. W. (2017). Projections of 21st century climate of the Columbia River Basin. Climate Dynamics, 49(5), 1783-1799. https://doi.org/10.1007/s00382-016-3418-7
Schwalm, C. R., Glendon, S., & Duffy, P. B. (2020). RCP8.5 tracks cumulative CO2 emissions. Proceedings of the National Academy of Sciences, 117(33), 19656-19657. https://doi.org/10.1073/pnas.2007117117
[1] See, for example, Figures A1 and A2 in Rupp, D. E., Abatzoglou, J. T., Hegewisch, K. C., & Mote, P. W. (2013). Evaluation of CMIP5 20th century climate simulations for the Pacific Northwest USA. Journal of Geophysical Research: Atmospheres, 118(19), 10-884. https://doi.org/10.1002/jgrd.50843