


Method for Determining the Cost-Effectiveness Limit for Conservation
The methodology and input parameters defined in this section can be used to calculate energy efficiency measure cost-effectiveness relative to the findings of the 2021 Power Plan. That is, the resource strategy determines the overall energy-efficiency target and applying that to the achievable technical potential will dictate the cost-effectiveness formulation. As energy efficiency measures are reviewed and updated, conservation program managers, the Regional Technical Forum, and regulators should use the benefit/cost ratio method outlined below to determine cost-effectiveness for measures relative to the plan. The RTF will provide clear guidance on cost effectiveness at the measure application level following this methodology and these parameters for the measures it maintains and these should be adopted by Bonneville to meet its cost-effective efficiency savings obligations as outlined in Section 8 of the 2021 Power Plan.
This method assures that all the costs and benefits are captured, that the time-dependent shape of the savings are accounted for, and that the capacity contribution of the measures are fully considered. It is consistent with the approach outlined in the Quantifiable Resource Cost Framework. Individual entities may have differing input values than the ones presented below, given specific needs, but the methodology to estimate these parameters should be consistent. If a measure’s benefit-to-cost ratio from this perspective is one or greater, the measure is considered cost-effective relative to the plan. This ratio is calculated as follows, where all parameters are in constant dollar value:
Benefit/Cost = NPV(energy + capacity + avoided annual O&M + other fuel + NEI + avoided periodic replacement)/ NPV(capital cost * (1+admin) + annual O&M + other fuel + NEI + period replacement)
Where NPV is the net present value and:
energy = kWhi,bb*((MP+C)i + RMC) * (1 + 10%)
and
capacity = kWpeak,bb * (Tavoid + Davoid + Ravoid) * (1 + 10%)
where i represents time segment (e.g., heavy/light load hours, monthly) and bb represents busbar. Loss factors of 2.3% for transmission (T) and 4.7% for distribution (D) are included for calculating busbar savings.
The terms are defined as:
| Term | Definition | Benefit? | Cost? | Value |
| NEI | Non-energy impacts ($) | X | X | Measure Specific |
| Other fuel | Non-electric (e.g., natural gas use) impacts ($) | X | X | Measure Specific |
| Periodic replacement | Difference in frequency of measure replacement relative to baseline ($) | X (avoided) | X | Measure Specific |
| Capital cost | Incremental measure cost relative to baseline ($) (includes equipment and labor) | X | Measure Specific | |
| Admin | Program administration cost adder | X | 20% | |
| Annual O&M | Operations and maintenance costs relative to baseline ($) | X | X | Measure Specific |
| kWhi,bb | Energy saved (in kWh) by time segment i at busbar | X | Measure Specific | |
| MP | Market price forecast ($/kWh) by time segment i | X | Forecast File | |
| C | Carbon cost forecast ($/kWh) by time segment i | X | Forecast File | |
| RMC | Risk mitigation credit for stochastic variation in inputs ($/kWh) | X | $0/kWh | |
| kWpeak | Power saved during peak periods (kW) | X | Measure Specific | |
| Peak | Period of highest value for system | X | See chart below | |
| Tavoid | Deferred transmission capacity credit ($/kW) | X | $3.54/kW-yr* | |
| Davoid | Deferred distribution capacity credit ($/kW) | X | $7.82/kW-yr* | |
| Ravoid | Deferred resource capacity credit ($/kW) | X | $123/kW-yr | |
| 10% | Regional act credit for conservation | X | 10% |
“Measure Specific” means that the value, if applicable, is unique to each measure
“Forecast File" means that the values for this attribute can be found in the MC_and_Loadshape file
*The deferred transmission and distribution credit values are updated slightly from the inputs based on additional utility data recieved after the development of the supply curves.
Many of these parameters are included in the net levelized cost of energy calculation used for the inputs in preparing the supply curves used for the portfolio analysis, see this section. However, the net levelized cost of energy calculated for the inputs do not include the dollar value of the energy savings nor the deferred resource credit. In addition, based on analytical results, the peak period has been modified from the inputs.[1]
Even though the measure energy savings are known, the total dollar value of these energy benefits is not known a priori; it is determined through the portfolio model findings. While the RPM uses a wide range of market prices, determined stochastically, it would be untenable to calculate each measure’s cost-effectiveness on a range of market prices. Instead, the Council used the base price forecast for this analysis determined using the external market price estimated in Aurora. This value is a result of an assumed resource build across the WECC that incorporates the social cost of carbon in the dispatch cost. In other words, MP + C becomes a single price stream.
The deferred resource credit was included after model findings highlighted the region’s adequacy need during the morning and evening ramp periods when net loads[2] are rapidly changing. The hours of interest – the peak periods - are highlighted in pink below, representing sunrise and sunset.
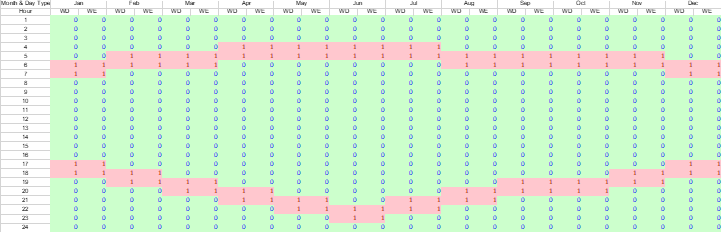
WD = weekday, WE = weekend
For this analysis, the Council determined the best estimate for the deferred resource credit is the discounted cost for the marginal resource that would have been built in absence of conservation. The best fit resource for the region is a short-duration (4 hour), 100 MW battery, with a 2020 levelized cost of $162 per kilowatt-year (2016$). Given that the conservation target is sufficient to approximately offset the build of a battery each year, the value of Ravoid is the annual deferred cost of this battery. In addition, the battery costs are anticipated to decrease with time. The price de-escalation is incorporated, resulting in a deferred resource credit of $123 per kilowatt-year (levelized).
The final parameter is the value of efficiency to avoid risk, part of the energy benefits formula as “RMC”. Because the Council assess a wide range of futures (varying loads, hydro conditions, temperatures) and multiple scenario analyses, the Council uses the risk mitigation parameter to approximate the value of conservation in reducing risk across all of the future unknowns. In other words, there is a premium to purchasing conservation to avoid more expensive resource development across the range of futures that is not represented from a single market price forecast used in ProCost or load forecast used to determine the supply curve inputs. The risk mitigation parameter is estimated so that the potential from all cost-effective measures (the economic achievable potential) is nearly equivalent to the conservation targets. For the 2021 Power Plan, the Council finds that a RMC of $0 per kilowatt-hour is needed to achieve the targets provided in Section 5, the Conservation Program (750 average megawatts by 2027 and 2400 average megawatts by 2041). In other words, adding in the deferred resource credit encompasses the value of conservation in offsetting system risks. In addition, if the Council had chosen not to include carbon damage cost in the market price, the RMC would have been non-zero, around $82 per megawatt-hour (levelized in 2016$).
For each sector, the regional achievable savings by major measure bundle is derived using a cost-effectiveness limit as calculated above using the base market price and load forecasts. A summary workbook with all measures and their benefit-cost ratio, as calculated by the formulation described, is available here. The savings are shown for the near term action plan period (through 2027) and for the entire period covered by the 2021 Power Plan (through 2041) for the residential, commercial, industrial, agricultural, and utility sectors. The purpose of these tables is to show the major sources of cost-effective energy efficiency identified in the Council’s 2021 Power Plan.
Resilience and Flexibility
The Council also considered including estimates of resilience and flexibility in the cost-effectiveness determination. Resilience represents the ability for a building to maintain comfort during prolonged power outages by maintain thermal comfort in conditioned spaces, improved air quality, avoiding freezing pipes. Flexibility represents the overall ability of the grid to balance supply and demand. This is primarily accomplished by having embedded controls for the utility to use buildings to dynamically adjust load and could also be through improved weatherization to minimize occupant disruption by changing HVAC settings. However, these are challenging to quantify and the deferred resource value already captures some of these benefits. If considered, not all efficiency measures provide these values. The table below highlights which measures in the 2021 Plan might include one or both of these values. Any measure that improves a buildings ability to ride-through a power outage or extreme weather event receives the resilience credit. Measures that provide controls (where the baseline does not) receives the flexibility credit. As described in the section on actions to support the conservation target, the RTF should work with other regional experts to determine these values for consideration in the subsequent power plan.
| Sector | Measure Category | Resilience | Flexibility |
| Commercial | Advanced rooftop controls | x | |
| Commercial energy management | x | ||
| Connected thermostats | x | ||
| Ductless heat pumps | x | ||
| Fans | x | ||
| Window Glass | x | x | |
| Heat Pumps | x | ||
| Secondary Glazing Systems | x | x | |
| Very High Efficiency - Dedicated Outdoor Air Systems | x | ||
| Variable Refrigerant Flow - Dedicated Outdoor Air Systems | x | ||
| Residential | Advanced Power Strips | x | |
| Air source heat pump upgrade to variable capacity systems | x | ||
| Behavior | x | ||
| Cellular shades | x | ||
| Ductless heat pumps | x | ||
| Ductless heat pumps in ducted applications | x | ||
| Duct sealing | x | ||
| Electric vehicle supply equipment | x | ||
| Weatherization | x | x | |
| Smart thermostats | x | ||
| Water heater pipe insulation | x |
[1] The deferred transmission and distribution capacity credits have also been slightly updated from the inputs based on utility data available after the development of the supply curves.
[2] Net loads represent loads net of resources, primarily solar resources.