


The resource strategy analysis determines the amount of energy efficiency and other resources to be developed to achieve least-cost and least-risk adequate electric system for the region. Findings from this analysis include year-by-year energy efficiency development goals, expressed in average megawatts of energy, to achieve a least-cost and least-risk system. The findings from this analysis are also used to establish energy efficiency cost-effectiveness methodologies to guide energy efficiency program development.
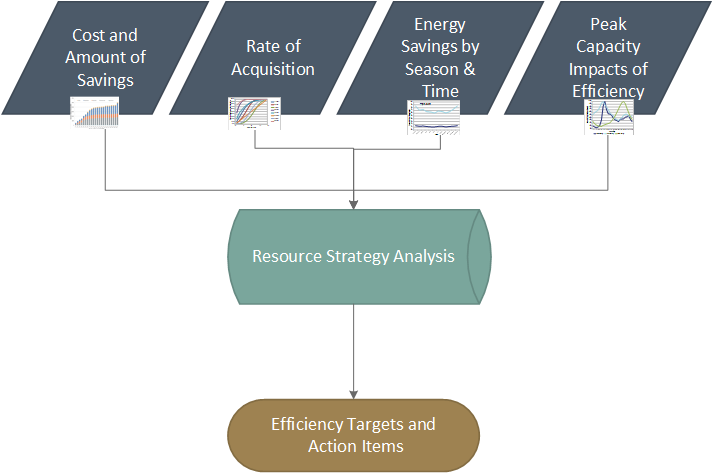
The figure below describes the overall process. The first tier of the figure below includes the development of inputs for the energy efficiency assessment. These inputs – cost and amount of savings, rate of acquisition, savings by season and time, and peak capacity impacts – are part of the resource strategy analysis and energy efficiency targets and related action items are an output of that analysis.
Key Energy Efficiency Inputs for Resource Strategy Analysis
The 2021 Power Plan uses a multi-step process to evaluate the cost and amount of energy efficiency to be developed for a least-cost and least-risk resource strategy. Energy efficiency supply curves are constructed based on cost and savings available from over 2,700 energy efficiency measure permutations across the residential, commercial, industrial, agriculture, and the electric utility system sectors. The energy efficiency supply curves, annual deployment limitations, and the seasonal and time of day availability of energy efficiency, and capacity impacts are all provided as inputs to the resource strategy analysis. One intrinsic assumption within the analysis is that energy efficiency is a long-term resource and the savings are persistent. That is, savings acquired in 2022 remain throughout the 20-year time horizon. Because of this, the 2021 Plan does not include savings from early retirement measures where the savings are only until the baseline unit would have been replaced anyway. This approach helps ensure the savings are consistent with the assumptions in the demand forecast.
Data on the cost and availability of generating resource options are also provided in the resource strategy analysis. The models test plans for the development of energy efficiency and generation resources across 300 different futures, varying loads, hydro conditions, and prices. The analysis produces strategies for energy efficiency and generation resource development that have lowest cost and lowest economic risk outcomes for the region. The Council then considers the energy efficiency strategies, along with practical considerations, to develop near-term energy efficiency targets and actions as well as cost-effectiveness guidance for near-term energy efficiency program decisions.
The analysis compares resources, including energy efficiency on a “generic” level. That is, it does not model a specific combined cycle gas or wind project, nor does it model specific energy efficiency measures or programs. Run time constraints limit the number of energy efficiency measures the models can consider. The analysis cannot consider individual measures and every specific load shape and perform a measure-specific benefit-cost ratio for each sub-component of energy efficiency. Therefore, the Council simplifies the set of energy efficiency measures available to the portfolio model by using 14 price bins.
Energy Efficiency Supply Curve Bins
The resources strategy analysis models energy efficiency resources using fourteen annual supply curve bins that represent the quantity of technically achievable energy efficiency available each year from 2022 through 2041 at levelized cost. The supply curves are differentiated by net levelized cost bin. The energy efficiency in these cost bins carry with them the shape and capacity characteristics of the combined set of measures in the cost bin. The cost bins are in the table below, along with the average cost and total amount of energy efficiency potential. Note, the models cannot select a portion of energy efficiency within a bin.
Net Levelized Cost Bins for Energy efficiency
| Bin | Cost Range (2016$/MWh) | Average Levelized Cost (2016$/MWh) | Maximum Energy Efficiency (aMW) |
| 1 | <$0 | -$47 | 515 |
| 2 | $0-10 | $5 | 418 |
| 3 | $10-20 | $16 | 301 |
| 4 | $20-30 | $24 | 255 |
| 5 | $30-40 | $33 | 591 |
| 6 | $40-50 | $44 | 335 |
| 7 | $50-60 | $56 | 589 |
| 8 | $60-70 | $64 | 463 |
| 9 | $70-80 | $74 | 262 |
| 10 | $80-90 | $85 | 200 |
| 11 | $90-100 | $94 | 70 |
| 12 | $100-130 | $112 | 138 |
| 13 | $130-170 | $146 | 246 |
| 14 | >$170 | $547 | 710 |
The amount of energy efficiency resources technically achievable each year increases based on the assumption that programs are able to capture a larger share of the available potential over time, as determined by the ramp rates provided here. The models can acquire these technically achievable resources each year up to the quantity it determines to be cost-effective over the full planning period and across the 300 futures tested. However, the ramp rate for the measures in a specific cost bin are based on the year in which that bin is deployed in the resource strategy. For example, if bin 4 is first deployed in 2024, the achievability for that bin will begin at a low value, based on the first year of ramp rate acquisition, or Program Year 1 in this figure.
Supply Curve Workbook Structure
There are about 90 Excel workbooks used to develop the energy efficiency assessment. In addition, there are dozens of outside sources of data that are referenced. The workbooks are available here. Supporting data sources are identified and summarized in each measure workbook or otherwise made available to the extent it is not proprietary. Additional information regarding workbook structure and how to use them was presented to the CRAC.