


Overview
This section summarizes the general methodology used by the Council for estimating the energy efficiency resource potential in the region and describes the major sources of information used to prepare that analysis. It also provides a description of the spreadsheet workbooks containing the detailed input assumptions and specific source data used for each of the measures in the Council’s energy efficiency supply curves. The workbooks are available here. It is important to note that the Council’s work represents regional assumptions and the cost and savings may be different for an individual utility.
An energy efficiency “measure” is any device or method that results in electricity savings compared with its baseline. Costs and savings are estimated for over 2,700 measure permutations. These costs and savings, coupled with savings shape over time, capacity impacts, and estimates of the possible pace of deployment, are used to develop supply curves of energy efficiency potential available by year. The supply curves represent the amount, daily and seasonal shape, and capacity characteristics of energy efficiency available at different cost levels by year. Costs are expressed as NRC (Northwest Resource Cost) net levelized costs, in 2016 dollars, so they can be compared to the costs of power purchases and the costs of new resource development. The Council uses an in-house model called ProCost to calculate measure-level NRC net levelized cost, estimate the hourly, daily and seasonal savings, and identify capacity impact of efficiency measures. The levelized cost and savings potential amount, by season and year, and the capacity impacts are inputs to the resource strategy analysis.
The following sections describe the general inputs and methodology used by the Council in its assessment of regional energy efficiency resource potential.
- Measure Definition
- Baseline
- Units
- Technical Potential
- Achievable Technical Potential
- Achievable Economic Potential
General Energy Efficiency Resource Methodology
The first step in the Council’s methodology is to identify all the technically feasible potential energy efficiency savings in the region (note, some measures were not included due to limited data or resources during the time of supply curve development and examples are provided for each sector. This does not imply missing measures are not viable options for efficiency). This involves reviewing a wide array of commercially available technologies and practices for which there is documented evidence of electricity savings, accounting for current baseline conditions. For example, measures need to be more efficient than current codes and standards. Around 100 energy efficiency measure bundles were evaluated in developing the energy efficiency potential for the 2021 Power Plan and more than 2,700 measure permutations are combined into the energy efficiency supply curves. [1]
The general methodology for developing the potential from the individual measures is considered a bottom-up method. This means that the total regional potential estimates are built up from individual energy efficiency measures (e.g., efficient light bulbs, motors, refrigerators) multiplied by the number of applicable units in the region. These are then summed by bundle, category, and sector to reach the total regional energy efficiency potential. The overall steps for estimating the different types of potential are illustrated in the figure below. Note that the industrial sector uses a different (top-down) method [2]; see the Industrial Sector section for more information.
Overall Energy Efficiency Methodology
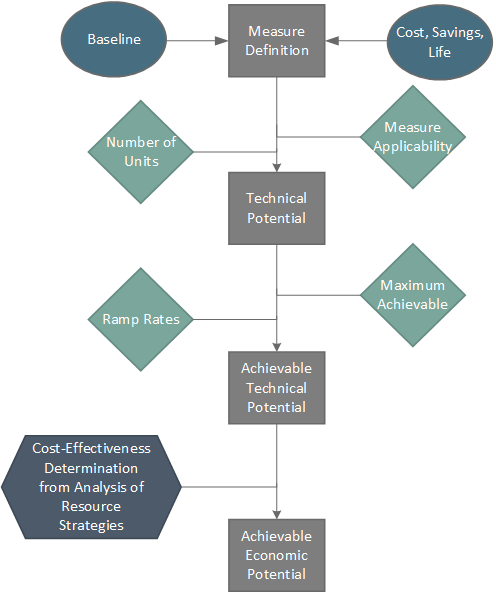
Each of these components is discussed further below.
Measure Definition
An energy efficiency “measure” is any device or method that results in electricity savings compared with its baseline. The Power Act defines conservation as “any reduction in electric power consumption as a result of increases in the efficiency of energy use, production, or distribution”. For a measure to constitute conservation under the Act, it must meet both parts of the definition. That is, the measure must reduce electric power consumption and the reduced consumption must result from an increase in the efficiency of energy use, production, or distribution. A measure that does just one or the other – for example, reduce electricity consumption but not through an efficiency increase – does not qualify as “conservation” under the Act.
Measures are identified from the range of measures currently in utility programs, as well as a broad search of utility potential assessments, emerging technology research, and input from local, regional, and national experts. Once the measures are identified, Council staff seeks to identify adequate and reliable savings and cost data. Costs and savings are based both on engineering estimates, as well as estimates based on results from the operation of existing programs. Note that although the Council included a wide-ranging list of measures, no energy efficiency assessment can include all efficiency measures that could be installed. Some measures were passed over due to lack of data or resources at the time of the supply curve development. The Council believes these omissions do not significantly impact results. A list of known missing measures is provided as part of the discussion about each sector.
The efficiency measures are grouped into three bundles: new construction, natural replacement, and retrofit applications. [3] There are two reasons to distinguish these application modes. First, costs and savings can be different by application mode. Second, in the case of new construction and natural replacement, the available stock for the measure depends on the forecast of new additions and replacement rate for equipment. These opportunities are tracked separately over the course of the forecast period and limit the annual availability of energy efficiency opportunities.
Measure costs, savings, applicability, and achievability estimates are identified separately for each of the new construction, natural replacement, and retrofit application modes. Measure costs and savings are analyzed on an incremental basis. Measure cost is the incremental cost over what would be done absent the measure or program. The same is true for savings. Incremental measure costs and savings can be different depending on the application mode. For example, incremental costs of high-performance windows in a new construction application only include the additional cost of the windows compared to what would be required by code. In a retrofit application, the labor cost of removing and replacing the existing window are added to the measure cost.
Baseline
The “baseline” refers to the conditions of the electricity-using buildings, systems, and devices at the start of the plan. For energy efficiency, the baseline is what the energy efficiency is measured against. The baseline estimate is a critical factor in determining both energy savings and forecast energy demand. The Council uses a frozen efficiency baseline forecast. Estimates of current market conditions and characteristics of the building stock come from several sources. Key among these are the residential, commercial, and industrial stock assessments completed by the Northwest Energy Efficiency Alliance (NEEA), selected studies from utilities, Bonneville, Energy Trust of Oregon, and other sources.
For new construction and replacement equipment, baseline conditions are the more efficient of either (1) minimum applicable code or standard or (2) market conditions at the start of the planning period. State building codes and federal and state standards for equipment are continually being upgraded. The baseline assumptions for codes and standards used in the 2021 Power Plan are those that were adopted at the end of 2019. Some of these include standards that were adopted before the end of 2019, but with effective dates that occur in the future. For such codes or standards, both savings estimates, and the demand forecast reflect the effective dates of adopted standards. If current market practice is more efficient than code, baselines are generally estimated using the average efficiency as typically taken from available sales data. Lacking sales data, other sources are used such as retail stocking data, ENERGY STAR market share data, distributor sales data, and store shelf surveys. The estimates for current market practice are estimated as of the beginning of 2021. Cost data are from utility program data, US DOE National Impact Assessment workbooks, or on-line retail stores. There is a baseline assumption for each measure in the analysis. These baseline assumptions are described in the measure workbooks.
Units
Coupled with the baseline efficiencies are the counts of buildings/systems/devices. In all cases, the number of units is tied to the demand forecast. In development of the forecast, the Council projects the total number of units (e.g. households, by state and segment, or commercial square feet, by state and segment) over the 20-year planning horizon. These quantities, multiplied by the saturations and electric fuel shares, give the total number of units available. For example, the number of refrigerators is equal to the number of households times the average number of refrigerators per home. Within the sector-specific sections below, more details are provided on the sources for number of units.
Technical Potential
Technical potential is the amount of energy efficiency that is technically feasible. It considers energy efficiency measures and the number of these measures that could physically be installed, without regard to achievability or cost. For example, electricity savings from heat pump conversions are only “technically feasible” in homes that have, or are forecast to have, electric forced air furnaces. Similarly, increasing attic insulation in homes can only produce electricity savings in electrically heated homes that do not already have fully insulated attics. It can be viewed as the upper limit of what energy efficiency potential is available.
The total technical potential is determined by the per-unit savings multiplied by the number of units in the region. Using the refrigerator example again, the 2021 Plan estimates (generally from secondary data such as regional stock assessments) the total number of refrigerators per household. This, multiplied by the number of households in the region, will provide the total number of refrigerators within the region. The total regional potential is then calculated by the total number of units times the savings per refrigerator. In addition, the annual technical potential accounts for the turn-over rate of refrigerators. That is, a refrigerator lasts approximately 15 years; as such, the 2021 Plan estimates that each year 1/15 of all refrigerators in the region are replaced. The number of available units is based on measure applicability.
Measure applicability reflects two major components: technical applicability and measure saturation. First is the technical applicability of a measure. Technical applicability includes what fraction of the stock the measure applies to. Technical applicability can be composed of several factors. These include the fraction of stock that the measure applies to, overlap with mutually exclusive measures, and the existing saturation of the measure. Existing measure saturation reflects the fraction of the applicable stock that has already adopted the measure and for which savings estimates do not apply. When the baseline is equivalent to the average market conditions, then the measure saturation is set to zero.
Achievable Technical Potential
The achievable technical potential is the technical potential multiplied by two factors: the maximum achievable acquisition assumption and the annual acquisition ramp rate (see figure below). This provides the upper limit of annual energy efficiency resource development that reflects the Council’s estimate of the maximum that is realistically achievable. Since there is no perfect way to know this limit, the Council used several approaches to develop estimates of annual achievable energy efficiency limits. First, the Council reviewed historic regional energy efficiency achievements and considered total achievements, as well as year-to-year changes. The Council also considered future annual pace constraints for the mix of energy efficiency measures and practices on a measure-by-measure basis.
The first factor in calculating the achievable technical potential, maximum achievable amount, assumes a maximum amount of the total potential could be acquired over the 20-year plan period. This maximum amount assumes that there will be some portion of non-adopters within the plan period – non-compliant equipment or buildings where the owner has no interest in improving. For the 2021 Plan, this maximum achievable fraction was set to 85 percent for all retrofit measures and either 60, 95, or 100 percent for lost opportunity measures. The determination of the upper limit was based on the recent activity around federal appliance standards (more regular updates results in a higher maximum achievability) or the speed of the market change (fast moving markets have higher maximum achievability). Note, only one lost-opportunity measure (waste-water heat recovery) was assigned 60 percent maximum achievable, the rest were 95 or 100 percent.
The second factor is the rate of annual deployment, which represents the upper limit of annual energy efficiency resource development based on implementation capacity. Such constraints include the relative ease or difficulty of market penetration, regional experience with the measures, likely implementation strategies and market delivery channels, availability of qualified installers and equipment, the number of units that must be addressed, the potential for adoption by building code or appliance standards, and other factors.
The annual acquisition ramp rates used in the 2021 Power Plan are illustrated in the figure below. This family of ramp rates is applied to all the measures to reflect the pace of acquisition over the 20-year plan period. Measures for which there is an established infrastructure or for which the market is rapidly changing are given a fast ramp rate, while measures that are new in the region, or that have experienced sluggish adoption rates are assigned a slow ramp rate. The annual acquisition rate multiplied by the total number of units available in a given year provides the maximum annual achievable technical potential. The Council also considers region-wide energy efficiency program accomplishments when developing these ramp rates to help align early year potential with recent historic accomplishments. Note that acquisition year one corresponds to the first year in which that measure is selected in the resource strategy analysis, which may not be the first year of the 2021 Power Plan (i.e. 2022). To test the sensitivity of these ramp rates and maximum achievable acquisition assumptions, the Robustness of Energy Efficiency scenario explored in the 2021 Power Plan used alternate values. More details on that scenario can be found here.
Energy efficiency Acquisition Ramp Rates
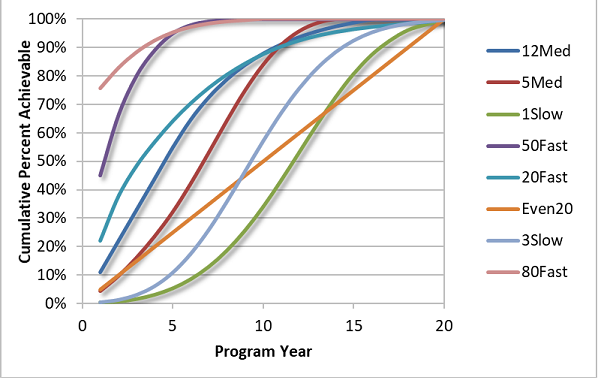
Assumptions for the ramp rates applied to each measure are detailed in the energy efficiency supply curve workbooks described by sector.
Achievable Economic Potential
The achievable economic potential is determined by the Plan's resource strategy—it is the recommended amount of energy efficiency the region should acquire in the short term and the long term (750 average megawatts by 2027 and 2400 average megawatts by 2041). Whether a measure is cost-effective (i.e. part of the achievable economic potential) is calculated from the achievable technical potential by applying the cost-effectiveness methodology (found here). Only measures that have a benefit cost ratio greater than one are considered economic. The results by sector can be found here.
[1] Measure bundle, measure, and measure permutation represent different levels of aggregation, where the permutation is the most disaggregated. For example, a heat pump water heater represents a measure bundle, Tier 3 unit represents a measure, and a Tier 3 unit in an indoor space of a single-family home represents a permutation.
[2] A top-down, or whole building, approach may be used for the commercial and residential sectors as well, but was not employed to estimate potential for this plan as the overall impacts are comparable, though there may be cost implications. This approach is likely more pertinent for program delivery than savings potential estimation. In the Research & Development section the Council recommends additional data collection to support whole building approaches, particularly for the commercial sector.
[3] Equipment or systems that are replaced at the end of their life are considered a natural replacement opportunities. At this time, there is an opportunity to replace the equipment or system with a more efficient alternative and are considered lost opportunities resources. The timing for retrofit measures improvements is discretionary, and not depended on equipment end of life.