


This section contains descriptions of the R-script that transform outputs from the classic GENESYS into input data for the redeveloped GENESYS. More specifically, the classic GENESYS storage outputs are transformed into target storage constraints for the redeveloped GENESYS.
The classic GENESYS models the Northwest hydro-system operations, and an example storage output for Grand Coulee Dam (COULEE) is presented in the figure below. The Figure shows the end-storages in 14-period HYDSIM time-steps (see classic GENESYS section for more details).

An example classic GENESYS output for COULEE storage (in units of KSFD) in 14-period HYDSIM time-steps
The COULEE end-storages above are printed in column-delimited format where data are printed in specified columns. For example, the WYR (third) column lists the water-years of the streamflows used in the hydro-regulation simulations. For the data displayed, there are 10 water-years, from 2020 to 2029, from a climate scenario (see summary of climate change scenarios write-up for more details).
Furthermore, after the WYR column, the 14 columns, OCT, NOV, DEC, JAN, FEB, MAR, AP1, AP2, MAY, JUN, JUL, AG1, AG2 and SEP represent the 14 HYDSIM periods. For example, the OCT period represents October; and later, the AP1 period represents the first half of April, from April 1 to April 15; after that, the AP2 period represents the second half of April, from April 16 to April 30; and later, the AG1 period represents the first half of August, from August 1 to August 15; and after that the AG2 period represents the second half of August, from August 16 to August 31.
The interpretation of this 14-period storage data becomes easier after they have been formatted by an R-script which result in the figure below.

A portion of the 14-peirod Coulee storage data in Figure 1 expressed in long format.
In the figure above, the long-format data were transformed from the wide-format data in previous table. Column A lists the water-years, and column B lists the 14 periods for each water-year, which begins with the OCT period and ends with the SEP period. Then column C displays the last days of the corresponding periods in column B. For example, for water-year 2020, the last day of the OCT period is 10/31/2019 (cells B1 and C1 respectively), and the last day of the AP1 period is 4/15/2020 (cells B9 and C9 respectively), and so on. Finally, column D lists the COULEE storage data, in units of KSFD, that are reached on those dates in column C. For example, on 1/31/2020, COULEE’s storage is regulated to be at 2379.0 KSFD (cells C6 and D6 respectively), and on 8/15/2020, the storage is to be at 2295.3 KSFD (cells C14 and D14 respectively).
The classic GENESYS COULEE storage output data in 14-period time-steps presented in above are transformed into COULEE storage input data in weekly time-steps for the redeveloped GENESYS. The transformation is based on a type of interpolation of the 14-period storage data, and some example calculations are presented in the figure below.
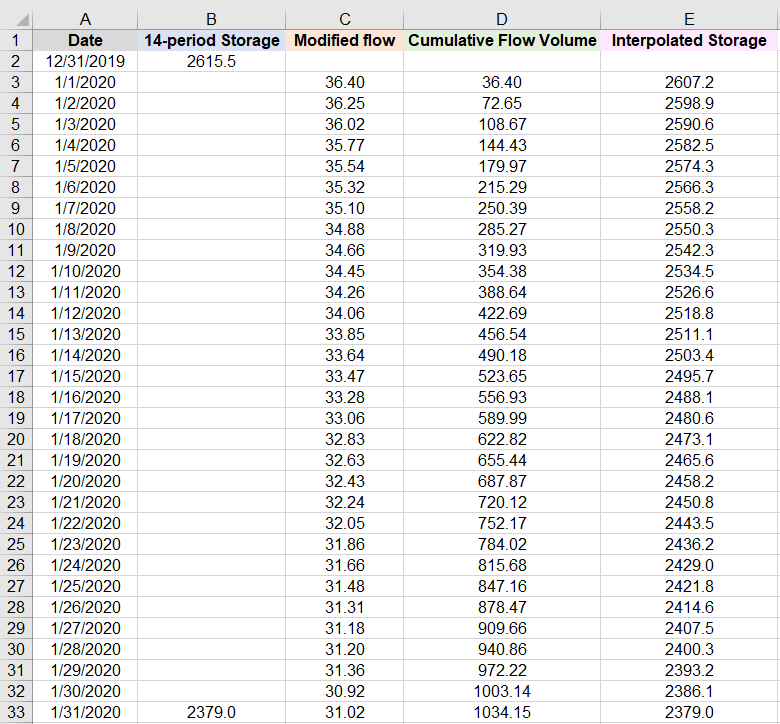
An example interpolation calculation of the 14-period COULEE storage data into daily COULEE storage data.[JO3]
In the figure above, for water-year 2020, column B lists the COULEE end storages for the DEC and JAN periods, at 2,615.5 KSFD and 2,369.0 KSFD (cells B2 and B33) respectively, which are set on the DEC and JAN period end-dates on 12/31/2019 and 1/31/2020 (cells A2 and A33) respectively, as printed in column A. These values are obtained from cells C5, D5, C6 and C6 in the previous figure. Column A in the above figure also populates all 32 days between 12/31/2019 and 1/31/2020.
The interpolation calculations are based on the ratio between the cumulative daily flow volume and the period flow volume. The details are as follows: column C lists the COULEE daily modified flows in units of KCFS. Thus, the daily flow volumes have the same values as the modified flows but are in units of KSFD. For example, let each day be represented by an index such that 1/1/2020 is represented by j=1 and 1/31/2020 is represented by j=31 . Then on 1/1/2020 the daily volume is V1=36.40 KSFD (cells A3 and C3 respectively); on 1/2/2020, V2=36.25 KSFD (cells A4 and C4 respectively); on 1/3/2020, V3=36.02 KSFD (cells A4 and C4 respectively), and so on. Furthermore, the JAN period flow volume is just the sum of the daily flow volumes from 1/1/2020 to 1/31/2020, which amounts to VJAN=1,034.15 KSFD .
Next on 1/1/2020, the cumulative daily flow volume is [CV]1=V1=36.40 KSFD ; on 1/2/2020, [CV]2= V1+ V2=72.65 KSFD ; on 1/3/2020, [CV]3= V1+ V2+ V3=108.67 KSFD , and so on. Of course, [CV]31=VJAN=1,034.15 KSFD , by definition. The cumulative daily flow volumes are printed in column D in the figure below. Finally, Sj , defined as the interpolated January COULEE storage for day with index j is calculated as
In the equation, SDEC=2,615.5 KSFD and SJAN=2,379.0 KSFD are the DEC and JAN end storages (cells B2 and B33) respectively. And [CV]j is the cumulative flow volume for day with index j and VJAN= 1,034.15 KSFD is the JAN period flow volume. The interpolation equation for Sj depends on the ratio [CV]j/VJAN , which is a ratio between the cumulative daily flow volume [CV]j and the period flow volume VJAN, as mentioned previously. The Sj's for January as calculated by the equation are listed in column E in the figure above.
For the redeveloped GENESYS, for water-year 2020, the four weeks of January begins on 1/1/2020, 1/8/2020, 1/15/2020 and 1/22/2020 respectively, and ends on 1/7/2020, 1/14/2020, 1/21/2020 and 1/28/2020 respectively. Thus, filtering for those weekly end-days in columns A and E in the figure above results in the weekly interpolated COULEE end-storages and presented in the figure below.

The four weekly COULEE interpolated end-storages for January
The weekly COULEE end-storages for other periods are calculated using the same interpolation method presented. And weekly end-storages for other hydro-projects are calculated in the way.
The weekly end-storages become weekly target storage constraints as inputs in the redeveloped GENESYS. The R-script performs the weekly interpolations of the 14-period storage output for all the regulated projects in the classic GENESYS and formats the results appropriately for inputs into the redeveloped GENESYS. An example input file showing five hydro-projects is presented below.

An example weekly end-storage input file showing five hydro-projects for the redeveloped GENESYS.[JO5]
In the figure above, columns B to F are the weekly interpolated end-storages for five projects, Grand Coulee (COULEE), Chief Joseph (CH JOE), Chelan (CHELAN), Libby (LIBBY) and Dworshak (DWRSHK) for the weeks from January to June of water-year 2020 listed in column A.
In the previous figure, the last days of the weeks are printed in column A since it is on those dates that the COULEE end-storages are to be reached. However, the convention used in the redeveloped GENESYS is to list the first day of the week in column A even though the end-storages in columns B to F are to be applied on the last day of the week. Therefore, in the above table, the January dates in column A are six days earlier than the corresponding January dates in column A in the previous step.
Furthermore, because the redeveloped GENESYS model has a weekly time-step, and thus the need for weekly inputs, for which there is no December 31 or the leap day, February 29, during a leap year. For example, in cell A10 in the figure above, the first day of that week starts on 2/26/2020. That week then continues with 2/27/2020, 2/28/2020, then skips 2/29/2020, but continues with 3/1/2020 to 3/4/2020 for the seven days. However, the end-storage values in cells B10 to F10 do take into account the leap day during the interpolation calculations.