


This section jumps into detailed results from the H2E Case of the transportation study.
Information can be found here about how the model was developed and set up for case studies. Key model findings and high-level summary can be found here. Unless otherwise specified, the results shown are for the region as a whole.
The results of the three model cases were evaluated for:
- Fuel consumption
- Electrification: electric vehicle sales, stock, and demand for electricity
- Hydrogen demand: fuel cell vehicles and the indirect electricity requirements to produce hydrogen via electrolysis
- Vehicle tailpipe emissions[1]
An additional dataset with results for this case is available TPT_ModelResults_H2E_Case.xlsx.
Roadway Transportation Mode Categories
| Category Name | Description | Weight |
| LDV | Light duty vehicles such as passenger cars, mini vans, sport utility vans, and small pickup trucks | < 8,500 lbs. |
| HDV Light | Commercial light trucks, Class 2 | 8,500 to 10,000 lbs. |
| HDV Med | Larger trucks, Class 3 through 6 | 10,000 to 26,000 lbs. |
| HDV Heavy | Freight trucks, Class 7 and higher | > 26,000 lbs. |
| Bus | Transit and School |
Transportation Vehicle Fuel Options
| Fuel | LDV | HDV Light | HDV Med | HDV Heavy | Bus |
| Gasoline | X | X | X | X | X |
| Diesel | X | X | X | X | X |
| Natural Gas | X | X | |||
| Direct Electricity | X | X[2] | X | ||
| Hydrogen | X[3] | X[3] |
The H2E Case builds on the High Electric Case with the same direct electrification of the LDV, Bus and HDV Light categories plus a transition to hydrogen fuel cell vehicles for the HDV Med and Heavy categories.
Fuel Consumption
By moving the HDV Med and Heavy categories from diesel to fuel cell technology, petroleum-based fuel use drops by 35% by the end of the study horizon. Hydrogen consumption for the fuel cell vehicle transport begins in year 2026 and grows rapidly after 2040. The timeline for hydrogen use really depends on when or if large scale hydrogen infrastructure is built. This model offers a “what-if” as if the build out does occur.
Annual Fuel Consumption – H2E Case
| Fuel | Units | 2020 | 2025 | 2030 | 2035 | 2040 | 2045 |
| Gasoline | Million Gallons | 5,436 | 5,399 | 4,970 | 4,357 | 3,672 | 2,955 |
| Diesel | Million Gallons | 2,578 | 2,793 | 3,013 | 3,178 | 3,006 | 2,255 |
| Natural Gas | Tbtu | 35 | 36 | 35 | 32 | 28 | 24 |
| Direct Electricity | GWh | 555 | 2,910 | 10,917 | 21,685 | 33,036 | 43,396 |
| Hydrogen | kTonne H2 | 0 | 0 | 29 | 177 | 779 | 2,185 |
Percentage of Ton-miles Traveled by Fuel Type HDV Light Category – H2E Case
| Fuel | Units | 2020 | 2025 | 2030 | 2035 | 2040 | 2045 |
| Gasoline | % | 58 | 59 | 60 | 54 | 36 | 18 |
| Diesel | % | 42 | 40 | 38 | 34 | 22 | 11 |
| Direct Electric | % | 0 | 0 | 2 | 12 | 41 | 70 |
| Hydrogen | % | 0 | 0 | 0 | 0 | 0 | 0 |
Percentage of Ton-miles Traveled by Fuel Type HDV Medium Category – H2E Case
| Fuel | Units | 2020 | 2025 | 2030 | 2035 | 2040 | 2045 |
| Gasoline | % | 7 | 7 | 8 | 8 | 7 | 5 |
| Diesel | % | 93 | 93 | 91 | 87 | 73 | 48 |
| Direct Electric | % | 0 | 0 | 0 | 0 | 0 | 0 |
| Hydrogen | % | 0 | 0 | 1 | 5 | 20 | 47 |
Percentage of Ton-miles Traveled by Fuel Type HDV Heavy Category – H2E Case
| Fuel | Units | 2020 | 2025 | 2030 | 2035 | 2040 | 2045 |
| Gasoline | % | 8 | 9 | 10 | 11 | 10 | 7 |
| Diesel | % | 92 | 91 | 89 | 84 | 71 | 46 |
| Direct Electric | % | 0 | 0 | 0 | 0 | 0 | 0 |
| Hydrogen | % | 0 | 0 | 1 | 5 | 19 | 47 |
Consumption of Hydrogen by Category – H2E Case
| Category | Units | 2020 | 2025 | 2030 | 2035 | 2040 | 2045 |
| HDV Medium | kTonne | 0 | 0 | 8 | 47 | 216 | 621 |
| HDV Heavy | kTonne | 0 | 0 | 22 | 129 | 563 | 1,564 |
Electrification
The direct electrification results are identical in this case as for the High Electric Case. With the introduction of hydrogen fuel cell vehicles for the HDV Medium and Heavy categories, a calculation for the indirect electricity requirements was made. This is an estimate of the electricity required to produce the hydrogen that meets the transportation demand.
The table below has the estimated rate of electricity consumption to produce hydrogen assuming electrolysis is the production method, combined with requirements for hydrogen delivery – either compressed gas or liquid form. See the Hydrogen & Fuel Cells section for information on hydrogen production. The rate is expressed in units of kilowatt hours of electricity per kilogram of hydrogen produced and prepared for delivery.
Hydrogen Production + Delivery Rate - H2E Case
| Units | 2020 | 2025 | 2030 | 2035 | 2040 | 2045 |
| kWh per kg H2 | 62.375 | 59.205 | 56.835 | 54.265 | 51.695 | 48.025 |
The next tables show the resulting estimated demand for electricity to produce and deliver the hydrogen required to meet HDV fuel cell demand – in both GWh and aMW units.
Electricity Demand for Hydrogen Production and Delivery- H2E Case
| Category | Units | 2020 | 2025 | 2030 | 2035 | 2040 | 2045 |
| HDV Medium | GWh | 0 | 0 | 430 | 2,576 | 11,172 | 29,837 |
| HDV Heavy | GWh | 0 | 0 | 1,231 | 7,010 | 29,087 | 75,109 |
| Total | GWh | 0 | 0 | 1,661 | 9,586 | 40,259 | 104,947 |
| Category | Units | 2020 | 2025 | 2030 | 2035 | 2040 | 2045 |
| HDV Medium | aMW | 0 | 0 | 49 | 294 | 1,275 | 3,406 |
| HDV Heavy | aMW | 0 | 0 | 141 | 800 | 3,320 | 8,574 |
| Total | aMW | 0 | 0 | 190 | 1,094 | 4,596 | 11,980 |
Hydrogen infrastructure to support transportation is in nascent form; in fact, there are no hydrogen filling stations currently operating in the Northwest, so any estimates regarding the production and delivery of hydrogen are obviously rough. The electricity requirements for hydrogen are defined as indirect – and as was mentioned earlier, electrolysis is electricity intensive. Future hydrogen could be produced in the Northwest for use in the region, or it could be produced elsewhere and delivered to filling stations via truck or even pipeline. The mix of exactly where the demand for electricity for hydrogen production is unknown, but the Northwest might attract such investment due to the clean nature of the regional grid and cheap electricity.
Tailpipe Emissions
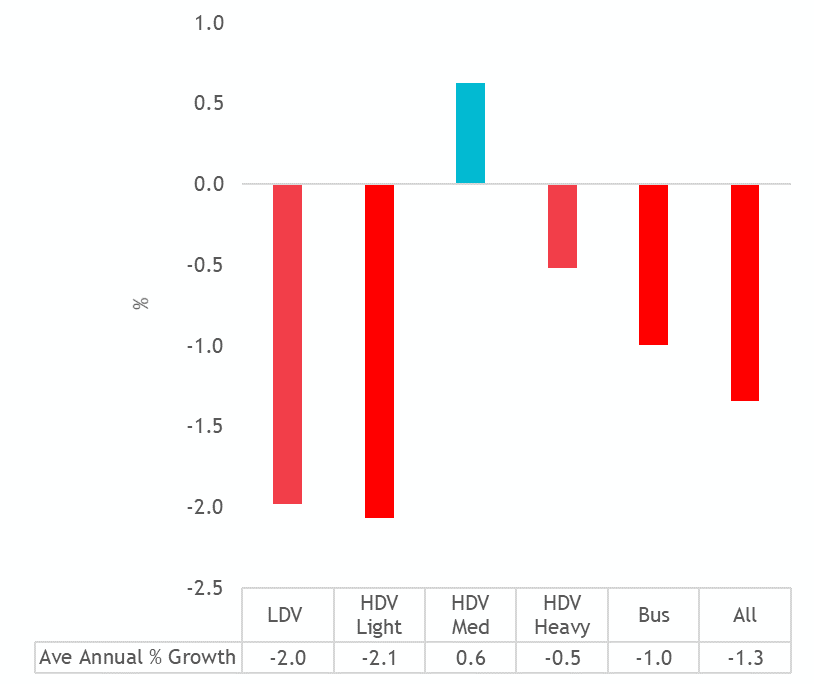
By reducing diesel fuel consumption in the HDV Med and Heavy categories through the use of hydrogen fuel cells, and electrifying the LDV and Bus modes, the overall roadway emissions are reduced by 34% over the planning horizon.
Average Annual Emission Growth Rate by Category – H2E Case
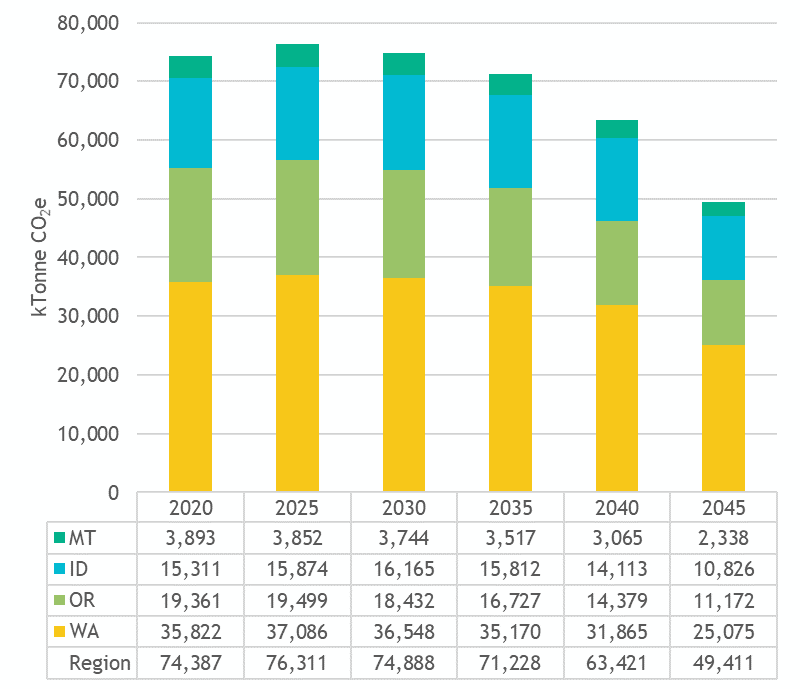
Annual Vehicle Tailpipe Emissions by State – H2E Case
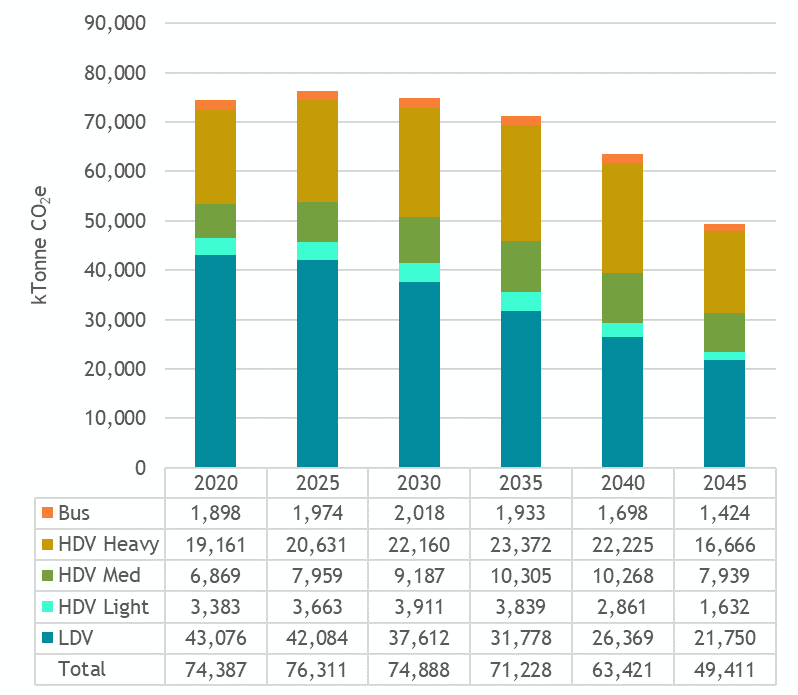
Annual Vehicle Tailpipe Emissions by Category – H2E Case
[1] Note: the indirect emissions from power generation related to electric vehicle demand are not included in this study but are included in other downstream power planning models
[2] High Electric & H2E Case only
[3] H2E Case only