


This section jumps into detailed results from the Reference Case of the transportation study.
Information about the model, how it was set up and definitions of vehicle categories and the model studies can be found here. Key model findings and high-level summary can be found here. Unless otherwise specified, the results shown are for the region as a whole.
The results of the three model cases were evaluated for:
- Fuel consumption
- Electrification: electric vehicle sales, stock, and demand for electricity
- Hydrogen demand: fuel cell vehicles and the indirect electricity requirements to produce hydrogen via electrolysis
- Vehicle tailpipe emissions[1]
An additional dataset with results for this case is available TPT_ModelResults_Reference_Case.xlsx.
Roadway Transportation Mode Categories
| Category Name | Description | Weight |
| LDV | Light duty vehicles such as passenger cars, mini vans, sport utility vans, and small pickup trucks | < 8,500 lbs. |
| HDV Light | Commercial light trucks, Class 2 | 8,500 to 10,000 lbs. |
| HDV Med | Larger trucks, Class 3 through 6 | 10,000 to 26,000 lbs. |
| HDV Heavy | Freight trucks, Class 7 and higher | > 26,000 lbs. |
| Bus | Transit and School |
Transportation Vehicle Fuel Options
| Fuel | LDV | HDV Light | HDV Med | HDV Heavy | Bus |
| Gasoline | X | X | X | X | X |
| Diesel | X | X | X | X | X |
| Natural Gas | X | X | |||
| Direct Electricity | X | X[2] | X | ||
| Hydrogen | X[3] | X[3] |
The Reference Case begins with an estimate of the current roadway transportation data set – passenger cars and trucks primarily gasoline powered, and heavy-duty vehicles mostly using diesel. A transition toward electric vehicles in the LDV space is modeled over time. The reference forecast for electric vehicle market shares was developed both quantitively within the model by evaluating historic sales and historic and forecast vehicle costs, and qualitatively based on feedback from the Demand Forecast Advisory Committee.
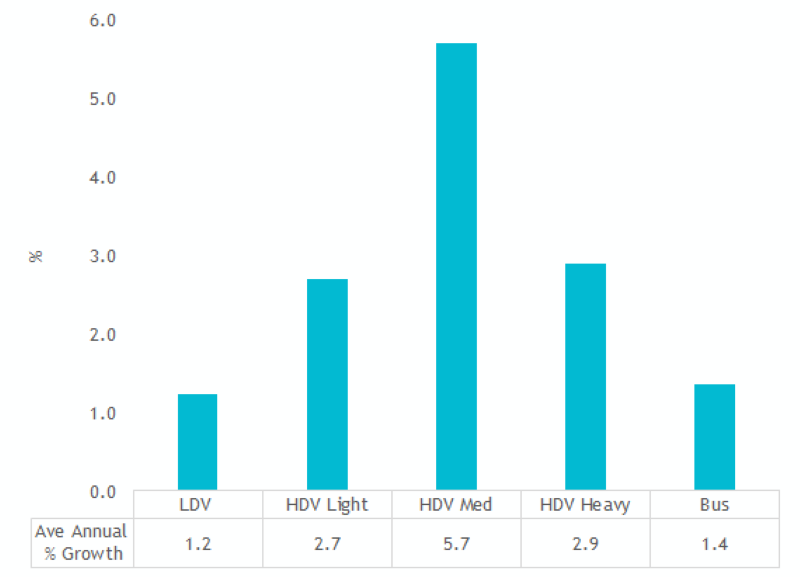
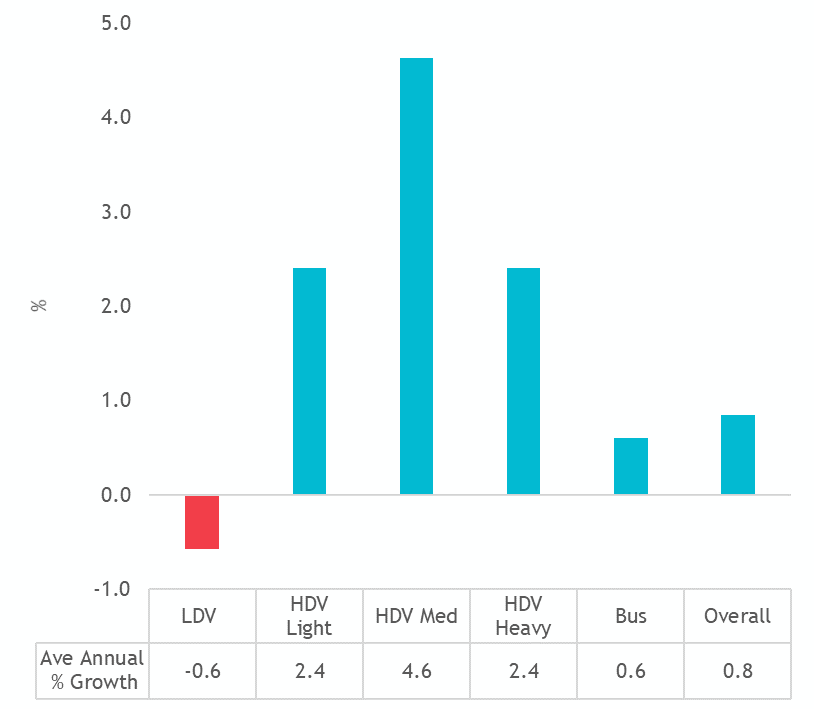
Future transportation requirements are forecasted for each transportation category. These requirements can be expressed in terms of annual vehicle miles traveled, or in the case of freight trucks (HDV Light, Med, Heavy), annual ton-miles traveled. The forecasted growth rates for these metrics are derived from historic trends in combination with the economic forecast drivers like population growth and gross domestic product. The Reference Case forecast of travel requirements shown in the next figure are kept consistent across the cases.
Average Annual Growth Rates for Vehicle Miles Traveled from 2020 to 2045
Fuel Consumption
In the beginning years, most of the roadway transportation in the region is powered by petroleum-based fuels. Over the 25-year forecast horizon, the fuel consumption of petroleum products – gasoline and diesel – grows by 19%. Much of the growth is coming from diesel use in the HDV Med and Heavy vehicle categories. Gasoline consumption in the LDV category declines slightly over time as electric vehicles gain market share, and gasoline powered vehicles improve in efficiency.
Annual Fuel Consumption – Reference Case
| Fuel | Units | 2020 | 2025 | 2030 | 2035 | 2040 | 2045 |
| Gasoline | Million Gallons | 5,440 | 5,517 | 5,551 | 5,550 | 5,486 | 5,350 |
| Diesel | Million Gallons | 2,578 | 2,791 | 3,039 | 3,347 | 3,727 | 4,199 |
| Natural Gas | TBtu | 35 | 35 | 35 | 34 | 34 | 33 |
| Direct Electricity | GWh | 526 | 1,415 | 2,943 | 5,282 | 8,698 | 13,348 |
| Hydrogen | kTonne H2 | 0 | 0 | 0 | 0 | 0 | 0 |
For the petroleum-based fuels, much of the total gasoline consumption is coming from the LDV category while much of the diesel fuel consumption is from the HDV categories, particularly the HDV Heavy category.
Gasoline Consumption by Category – Reference Case
| Category | Units | 2020 | 2025 | 2030 | 2035 | 2040 | 2045 |
| LDV | Million Gallons | 4,945 | 4,943 | 4,880 | 4,763 | 4,563 | 4,265 |
| HDV Light | Million Gallons | 251 | 277 | 307 | 342 | 384 | 436 |
| HDV Med | Million Gallons | 63 | 79 | 99 | 123 | 152 | 185 |
| HDV Heavy | Million Gallons | 173 | 210 | 257 | 313 | 379 | 455 |
| Bus | Million Gallons | 7 | 8 | 8 | 8 | 9 | 9 |
Diesel Consumption by Category – Reference Case
| Category | Units | 2020 | 2025 | 2030 | 2035 | 2040 | 2045 |
| LDV | Million Gallons | 21 | 18 | 16 | 14 | 12 | 11 |
| HDV Light | Million Gallons | 122 | 129 | 135 | 143 | 154 | 169 |
| HDV Med | Million Gallons | 623 | 717 | 829 | 962 | 1,118 | 1,303 |
| HDV Heavy | Million Gallons | 1,732 | 1,844 | 1,973 | 2,139 | 2,351 | 2,623 |
| Bus | Million Gallons | 80 | 83 | 86 | 89 | 91 | 93 |
Electrification
Electric vehicles have only recently entered the marketplace and vehicle model options have been fairly limited to date, especially in the light duty pick-up trucks and sport utility vehicle categories. Accordingly, the market share of electric vehicles in the region is modest at the start of the forecast. In the LDV space, the share of stock (vehicles on the road) that are electric is less than 1% at the beginning. However, sales of new electric vehicles are forecast to grow, from a beginning point of around 4% market share, increasing to 10% by 2025, and reaching 55% by 2045.
There is uncertainty as to how quickly electric vehicle sales will grow, especially considering the small market share of electric today. Impacts from state policy along with changes in the auto industry toward electric options could really affect the trajectory that electrification takes. Vehicle stock is slow to turn over, so the electric share of the vehicles on the road will lag sales.
Share of Electric Vehicles in LDV Category - Reference Case
| Market Share | 2020 | 2025 | 2030 | 2035 | 2040 | 2045 |
| % Sales Electric | 4.2 | 10.4 | 17.3 | 27.3 | 40.3 | 55.2 |
| % Stock Electric | 0.7 | 2.0 | 4.3 | 7.8 | 12.9 | 19.8 |
Total Vehicle Sales and Stock All Fuels LDV Category - Reference Case
| Vehicle | 2020 | 2025 | 2030 | 2035 | 2040 | 2045 |
| Unit Sales | 519,869 | 546,992 | 571,999 | 593,690 | 619,578 | 639,629 |
| Unit Stock | 13,039,465 | 13,657,980 | 14,196,376 | 14,677,918 | 15,122,458 | 15,546,015 |
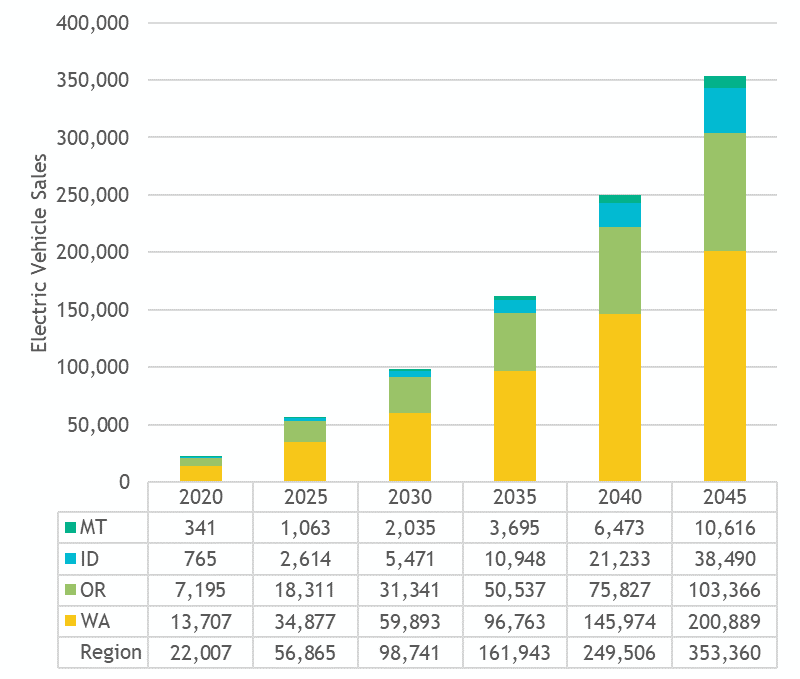
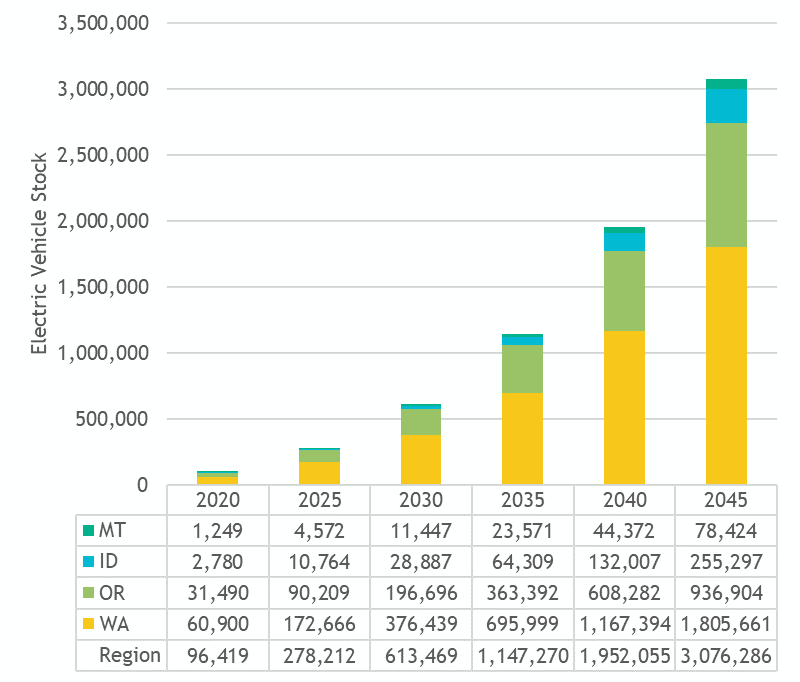
The following figures represent the forecast of the number of new electric vehicle sales and stock by state for the LDV category, plus the resulting forecast of annual electricity demand for the LDV category.
Annual LDV Electric Vehicle Sales by State - Reference Case
Annual LDV Electric Vehicle Stock by State - Reference Case
Annual LDV Electric Vehicle Electricity Demand by State – Reference Case
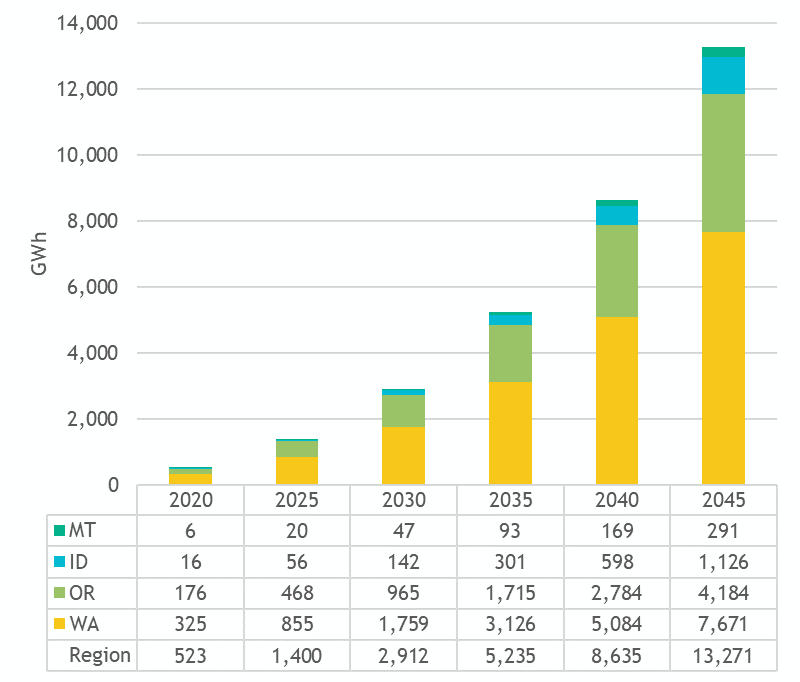
For those that prefer electricity demand in average mega-watts (aMW), the forecast corresponds to a starting demand of 60 aMW and growing to around 1,510 aMW by 2045. There is also modest demand growth for electricity from electric buses – this adds around 9 aMW by the end of the horizon.
Tailpipe Emissions
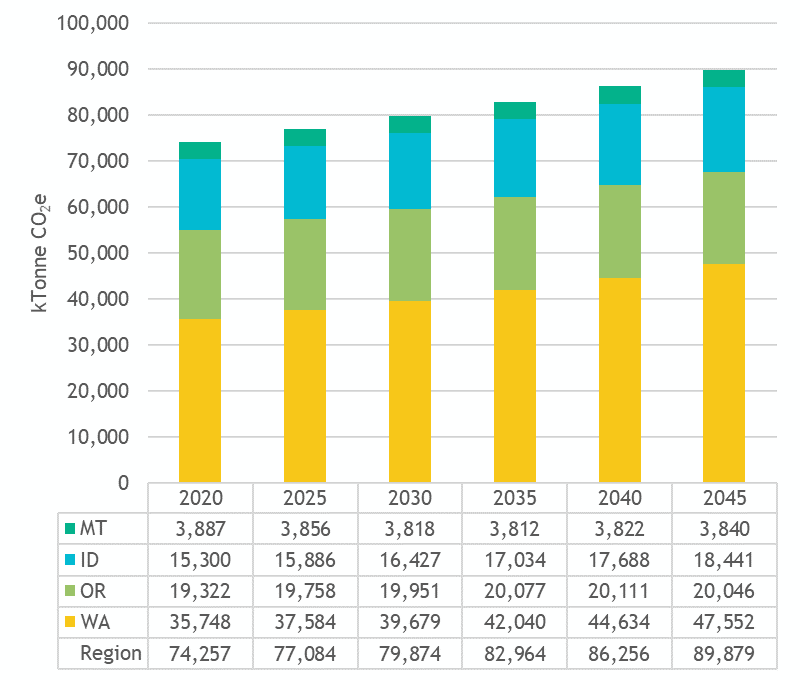
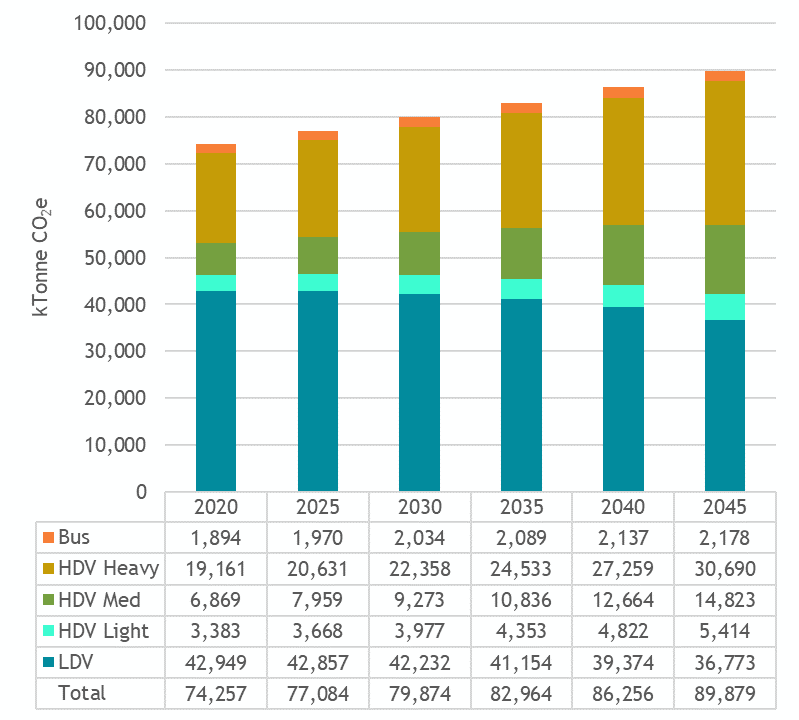
Vehicle emissions are calculated in units of carbon dioxide equivalencies (CO2e) based on the fuel usage results. Overall roadway emissions grow by 21% over the 25-year study horizon. Initially the LDV category contributes the highest percentage of emissions, but as passenger cars and light duty trucks move to electric over time, emissions in this category begin to decline, by 14% in this case. The bulk of emissions come from the HDV categories, essentially large trucks which in the Reference Case are limited to a diesel fuel option.
The average annual emission growth rates are shown below. The following two figures display the emission results by state and vehicle category.
Average Annual Emission Growth Rate by Category – Reference Case
Annual Vehicle Tailpipe Emissions by State – Reference Case
Annual Vehicle Tailpipe Emissions by Category – Reference Case
[1] Note: the indirect emissions from power generation related to electric vehicle demand are not included in this study but are included in other downstream power planning models
[2] High Electric & H2E Case only
[3] H2E Case only