


Onshore Wind
Jump to: Trends, Considerations and Resource | Description of Reference Plant
Wind power is a naturally occurring, renewable form of energy that is harnessed and transferred into electricity through power plants made up of individual turbines. Wind turbines primarily consist of a tower, two or three blades, hub and rotor, and a nacelle (consisting of interconnected shafts (low and high speed), a gear box, and a generator). As the wind blows, the turbine blades (connected at the hub and attached to the rotor) are rotated, with the rotor causing the low speed shaft to spin within the nacelle. Housed in the gearbox, the low speed shaft is connected to the high speed shaft, which increases the speed of the rotation. The gearbox is attached to the generator, which produces the electricity. Wind turbines typically possess weather vanes and anemometers (an instrument to measure wind speed) that transfer information to a controller. Between the controller computer system and remote operators, a wind turbine can be turned on and off depending on the wind speed as well as positioned depending on the wind direction. Today’s wind turbines typically cannot operate in winds higher than 55 miles per hour, and are therefore shut down to preserve the equipment when wind reaches that speed.
There are two primary forms of wind power resources – the established terrestrial, utility-scale onshore wind power and the emergent offshore wind power. A third form is distributed generation wind power, which typically comprises small output (average of 100 kilowatt) turbines used directly by the end-user to power a residence or commercial entity. For the 2021 Power Plan, onshore wind is categorized as a primary resource with multiple reference plants based off of location, while offshore wind is an emerging technology with future potential for the region.
Onshore Wind Trends, Considerations, and Resource Potential
Jump to: Technology Trends | Cost Trends | Development Trends | Environmental Effects | Resource Potential in Region | Opportunities and Challenges
The following section describes high level trends in technology, cost, and development for onshore wind. In addition, it identifies resource potential in the region, opportunities and challenges, and environmental effects.
Wind turbine technology is improving rapidly as turbine towers get taller, blades get longer (thus increasing rotor diameters), and the nameplate capacity of generators increase. In addition, advancements in the electronic components of the turbine – such as the gearbox – allow for greater control, efficiency, and reliability, and a decrease in fixed operating and maintenance costs.
The taller the turbine, the greater the wind sweep area (the circumference around the rotor in which the blades spin and capture or “sweep” wind – as seen in the graphic by NREL below) and the greater the access to a stronger wind resource class. This enables the turbine to produce more energy and usually equates to an increased capacity factor (actual energy production compared to nameplate capacity, or maximum output). An increase of 5 meters in hub height can allow for an additional 10 meters in rotor diameter.
Anticipated Growth in Wind Turbines Rotors and Hub Heights
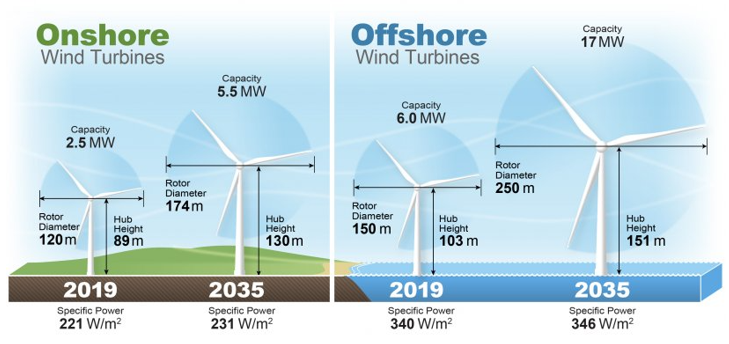
* Graphic by John Frenzl, National Renewable Energy Laboratory (NREL)
The nameplate capacities of wind turbine generators are also increasing. The figure below from U.S. Department of Energy’s 2018 annual wind technologies market report (prepared by Lawrence Berkeley National Lab) shows the trends in turbine nameplate capacity installations by year of operation. Over the past two decades, the average nameplate capacity of wind turbines installed each year has increased steadily from 0.8 megawatts in 2000 to 2.4 megawatts in 2018. In the last few years, the emergence of the 3.0-3.5 megawatt turbines are starting to become more prevalent after years of dominance from the 1.5 – 2.0 megawatt turbines in the years 2000 through 2014 and the 2.0-2.5 megawatt turbines in the years 2015 through 2017.
US DOE Wind Technologies Market Report: Increasing Turbine Nameplate Capacity
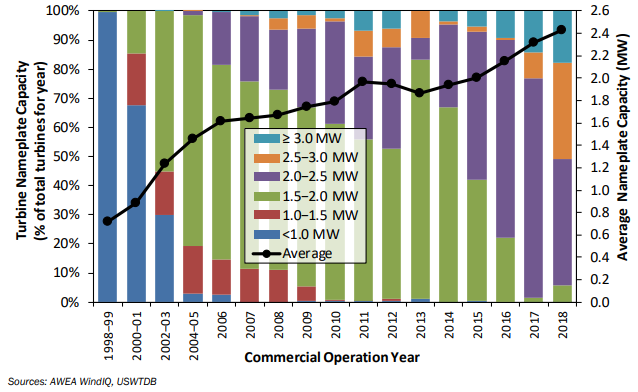
* Figure from the DOE 2018 annual wind technologies market report (prepared by Lawrence Berkeley National Lab)
In addition to increasing capacities, the specific power of wind turbines is also improving. Specific power is a term used to describe the ratio between the size of the generator (nameplate capacity, measured in Watts) to the swept area of the rotor (in square meters). Machines with lower specific power have a larger rotor sweep relative to generator size, thus fewer Watts per square meter (W/m2). Lower specific power machines also have higher capacity factors because they are able to sweep more wind through the turbines per watt of capacity and produce more energy on an annual basis. Developers have figured out that a lower specific power (around 200-250 W/m2) helps to maximize the energy capability of the wind power relative to its fixed nameplate capacity. This phenomenon is similar to the inverter load ratio (ILR) in solar PV technologies, where the inverter and generator are fixed (nameplate capacity), but you can increase the energy output (and chances of hitting that capacity) by adding more solar panels that feed the inverter. The lower specific power wind turbine generators were originally designed for lower quality wind sites but are increasingly being installed across the United States in both low and high class wind areas (for more information on wind classes, see the analysis on the existing wind fleet). See graphic below, showing the trend of installing turbines with lower specific power over time. (In contrast, the graphic above shows a slight increase to the specific power from 2019 to 2035. Despite significant increases in hub height, rotor diameter, and turbine capacity, the ratio between the generator (MW) and the swept area (m2) is still very similar.)
US DOE Wind Technologies Market Report: Decreasing Specific Power
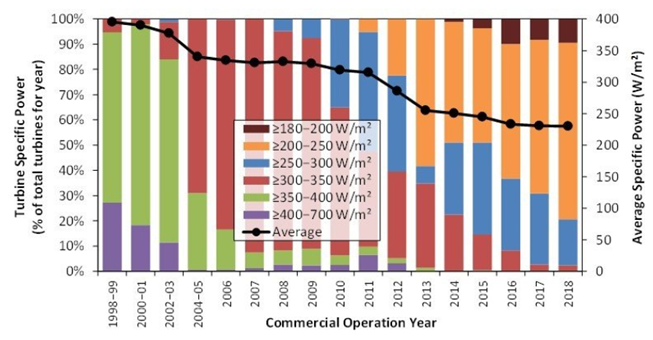
* Figure from the DOE 2018 annual wind technologies market report (prepared by Lawrence Berkeley National Lab)
Lower specific power wind machines are an appealing choice from an investor standpoint due in large part to the production tax credit (PTC) that has been available as a development incentive. The PTC is based on the amount of energy produced, so the more the project generates, the greater the tax benefit. And since machines with lower specific power have higher capacity factors, they receive higher PTC benefits. As the PTC and investment tax credit phase down, the continued trend toward using lower specific power machines is likely to continue. While the machinery can be more expensive in terms of capital cost, the higher capacity factor and adaptability to all wind classes should outweigh the initial investment. One potential drawback is that the higher hub heights and larger blades sustain more wear and tear when utilized in higher wind resource classes as they withstand greater wind speeds and turbulence. This can increase replacement or operating and maintenance expenses. This is not necessarily an issue in the Pacific Northwest, where the majority of the existing wind fleet is located in class 2 wind resource areas. A lower specific power machine does open up more possibilities in the class 3 and 4 wind resource areas that are more prevalent in the Pacific Northwest.
PNW Existing Wind Fleet by Wind Class
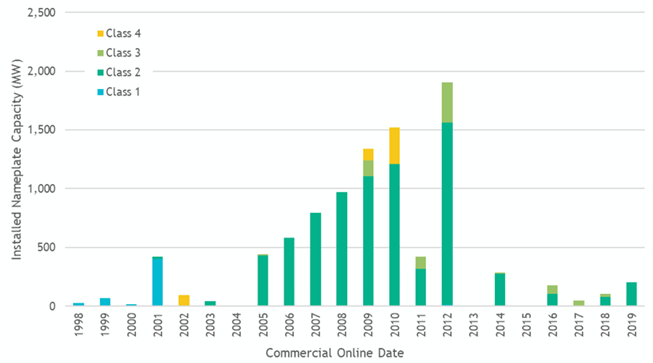
* Data from the Council’s generating resources project database
The capital costs of onshore wind technologies have declined significantly since they peaked in 2008-2009 during the economic recession. According to the Lawrence Berkeley National Lab[1], over the past decade, the installed cost of wind has decreased by about 40%. In the Seventh Power Plan (adopted in 2016), the Council was modeling a wind reference plant (in the Columbia Gorge) at about $2,380/kW (in 2016 year dollars). The mid-term assessment for the Seventh Plan (conducted in 2018), estimated a new wind plant capital cost in the range of $1,500-$1,700/kW. Now for the 2021 Power Plan, that estimate has dropped further to $1,450/kW. At the time of the Seventh Plan, these cost estimates were very much in line with what was being developed and estimated in the region and elsewhere.
As wind turbine technologies have improved significantly over the last ten years, so too have the costs. By increasing the hub heights (size of the tower), rotor blades, and nameplate capacity of the generators, project performance and energy output has increased. This has the effect of lowering the overall $/kW capital and installed costs, as well as the levelized cost of energy. Turbine generators are expected to continue to increase in capacity, and costs are expected to continue to decline – although to what extent is uncertain.
The figure below shows the data plots and analysis that was used to develop the 2021 Power Plan reference plant cost estimates. Note that this figure captures data from various onshore wind capacities, configurations, and technologies.
Overnight Capital Cost of Onshore Wind
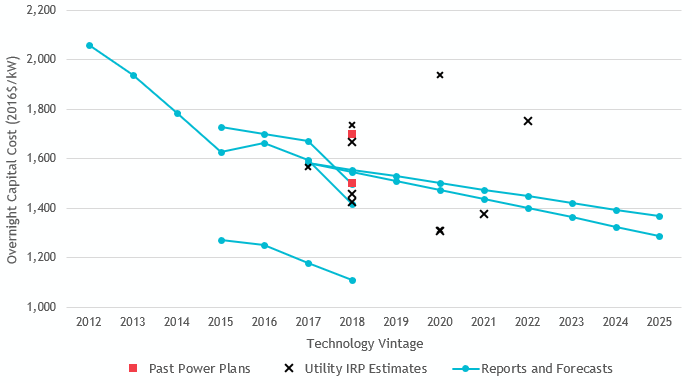
According to data from the U.S. Energy Information Administration (EIA), wind surpassed hydropower generation nationally for the first time in 2018. The majority of installed wind is located in the interior United States, where the wind resource is greatest and the flat landscape allows for easier site access and larger developments. The impending expiration of the federal tax incentives has led to significant new wind developments over the past few years as utilities and developers rush to take advantage of the credits before they are phased out. With record installation across the nation in 2019 and 2020, there are now over 113,000 megawatts of wind in operation across the United States – of which about 10,000 megawatts are located in the region. (See the existing regional wind fleet for more information.)
In the Pacific Northwest, the record year for wind nameplate capacity installations was 2012. In the years following, wind development slowed down considerably due to near-term state renewable portfolio standard (RPS) targets largely being met. Development has picked up again as clean energy policies have been introduced and the tax credits begin to phase down.
In addition, some of the more recent wind project developments have been spurred on by corporations directly acquiring renewable energy (without purchasing through a utility) as part of their clean energy initiatives and commitments. In order to preserve corporate customers, utilities have begun offering green power initiatives to secure renewable energy on behalf of their large customers.
See the Environmental Effects of Generating Resources for a high-level summary of some of the primary environmental effects of onshore wind. For an in-depth description of the lifecycle impacts associated with electricity generation, see Appendix I of the Seventh Power Plan.
The onshore wind reference plants considered and assessed by the Council for the 2021 Power Plan are assumed to comply with existing environmental regulations governing air and water emissions, siting regulations, waste disposal, and fish and wildlife protection and mitigation costs when quantifiable and directly attributable to the new resource. Extensive environmental impact statements throughout the siting and licensing process as authorized by FERC are accounted for in the overall project cost. For more information, see the section on Federal Statutes and Regulation Updates and the Methodology for Determining Quantifiable Environmental Costs and Benefits and Due Consideration.
Resource Potential in the Region
There is significant wind resource development potential remaining in the region. It is clear from the map below (which shows average wind speed at 100 meters) that the interior of the United States has the greatest wind resource (the darker the blue, the higher the wind speed). However, central and western Montana have areas with substantial wind resources, while Washington, Oregon, and Idaho also have areas with considerable potential. In addition, as wind turbine technology has improved, new developments are occurring in lower classified wind speed areas with turbines designed to maximize the lower wind resource available.
United States: Annual Average Wind Speed (meters/second) at 100 meters
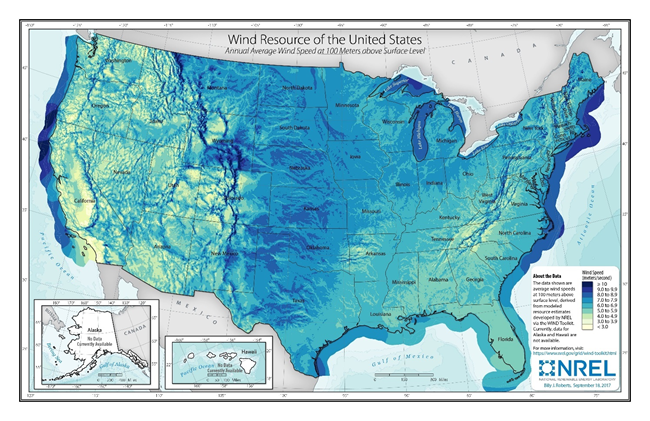
* Map from the US DOE Wind Energy Technologies Office WINDExchange platform, facilitated by the National Renewable Energy Laboratory.
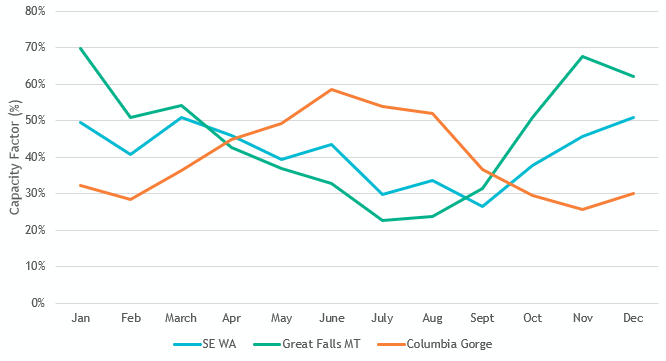
Using the System Advisor Model (SAM) from NREL, Council staff simulated the monthly average capacity factors for three locations in the region – southeast Washington, Central Montana, and the Columbia Gorge. Each location assumes an array of 60 wind turbine generators, at 3.6-megawatts turbine nameplate capacity, and 100-meter hub height (similar to the reference plant configuration and specifications). The figure below represents the average monthly capacity factor for each location based off of actual wind speed data from 2008 to 2012. The Columbia Gorge wind has a very clear summer peaking shape, while wind in southeast Washington and Montana are winter peaking resources. Much of the premier wind resource areas in the Gorge have already been developed, but due to existing transmission rights and technology advancements that take advantage of lesser wind resource sites, it is likely that development in the Gorge will continue. Southeast Washington and Montana have ideal energy shapes to complement the region’s hydropower system. Further, over the past five to ten years, the region as a whole has moved away from a winter peaking system to more of a dual peaking system with a second peak in summer. As more renewable resources are added to the grid, geographic diversity to the region’s wind fleet will help provide more consistent overall annual output. With the retirement of Colstrip coal units 1 and 2 in 2020, there may be additional opportunities to access existing transmission capacity in Montana for wind or other resources.
Average Monthly Capacity Factor, 2008 – 2012
Simulated as 3.6MW Turbine, 100m Hub Height
Other areas in the region show promise for wind resource development, for example southwest Washington and along the lower Snake River in Idaho. See the Council’s generating resources project map below for existing wind projects in the region, by project nameplate capacity (size of bubble) and wind class speed (color of bubble). Projects that are unknown are mostly newer projects and data are not yet available on wind class.
Map of Existing Wind, by Class, in the Pacific Northwest
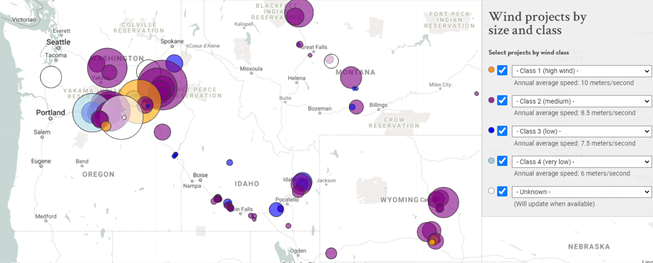
* Data from the Council’s generating resources project database
There are certainly opportunities for low-cost wind development in the region, but also some challenges as well – including long-term firm transmission access and uncertainty over the cumulative effects of significant renewable development on the environment and cultural resources.
With clean energy policies and renewable portfolio standards enacted in Washington and Oregon, and utilities and communities adopting clean energy goals across the region, there are significant opportunities for new wind resources to compete with other carbon free resources to meet those goals. In addition, the region is losing 60% of its coal fleet over the next decade and replacement resources will be needed to complement the existing system and meet demand.
Another opportunity for new wind technologies in the region is repowering the earlier generations of wind turbines that were developed in the region in the 2000’s and early 2010’s. Repowering an existing wind project consists of replacing aging wind turbine components with new, more efficient products and technologies. Repowering existing projects enables owners to maintain the best wind resource sites, improve the capacity and efficiency of the projects, and extend the useful life of the project. An additional incentive of repowering wind projects right now is that new turbine components qualify for federal tax incentives (PTC and ITC), which are phasing down or out at various intervals over the next few years. While the Council did not explicitly model repowered wind as a new resource option as it is extremely site specific, the plan does encourage utilities and regional entities to explore the suitability and efficacy of additional alternative cost-effective resources – including repowered wind.
Access to long-term firm transmission could be a limiting factor for new wind development in some locations in the region. New resources may face transmission access queues up to several years, creating a barrier to, or slowing, development. However, as evidenced by the Council’s transmission utilization analysis, it is common that a given transmission path could be fully contractually reserved on a long-term firm basis, while still having substantial available physical capacity most or all hours of the year. This means that there is often short-term capacity available for generators to purchase to transfer output to the grid. As part of the 2021 Power Plan’s research and development initiatives to support the resource strategy, the Council recommends that the region’s transmission providers work together with regional entities to explore solutions to alleviate new resource development barriers on the existing system in a cost-effective, strategic manner. See the R&D section for more information on this recommendation.
Another challenge is understanding and mitigating for all of the environmental effects and impacts to cultural resources (remains or indicators of past human experiences) when developing any new generating resource of quantity and magnitude. (See the methodology for developing quantifiable environmental costs and benefits for more information on how the Council analyzed and reflected environmental impacts in its power planning analysis.) In the reference plant analysis, the Council captured the costs and characteristics of a single plant, but what about the cumulative impacts of an entire fleet? With expected rapid development of new resources – and in particular new onshore wind and utility-scale solar PV – are there additional considerations that need to be taken into account prior to mass-scale development? The Council assessed some of the additional factors that come into play when considering a large-scale renewable development in a presentation to the Council in June 2021. There are potential cost-effective, sustainable, and strategic opportunities to mitigate the effects of these sizeable resource deployments and it is up to developers and owners to explore them. One example of an opportunity is to co-locate multiple generating projects (hybrid resources like wind plus battery storage) to minimize land and environment disturbances while also utilizing the same infrastructure (substations, roads, etc.) to reduce cost and streamline construction. Another example is to develop dual purpose projects in which a generating resource is paired with a complimentary trade – usually agriculture – to stack the benefits among both endeavors (e.g. livestock grazing). Wind projects take up substantial spatial acreage across the plant boundary, but the infrastructure (turbines, buildings, substation) only directly impacts about 1% of that space – this leaves extensive land acreage for other purposes.
The siting, construction, and operation of any generating facility has impacts on land and land uses, water resources, wildlife and wildlife habitat conditions, cultural resources, traditional uses, and local landowners and communities. Environmental effects of any proposed development are analyzed as part of state energy siting processes (if on private land) or by state or federal land management agencies (if on public land) through an array of different criteria and procedures. With various levels of siting and licensing regulations and approvals, there may be opportunities to optimize the siting process to help ensure that new, cumulative renewable resource development is carried out in a consistent manner that protects the wildlife, fish, cultural resources, and is inclusive of the local communities and landowners directly affected by new development. Some states and municipalities are including deliberate, strategic outreach and engagement in the siting process with local communities directly impacted by involving them early in the process and collaboratively identifying and mapping out agreed upon least-conflict siting zones ahead of any development. This allows for ownership of the process and support from the community and may include compromises by developers in order to successfully implement new projects. It is also imperative to ensure that tribes are explicitly and thoughtfully consulted with to understand and preserve cultural resources and traditional uses in the vicinity of new developments.
Description of Onshore Wind Reference Plant
There are three reference plants, based on locations with resource potential in the region – the Columbia Gorge, Southeast Washington, and Montana. Each reference plant comprises of sixty, 3.6-megawatts wind turbine generators at 105-meter hub height, creating a total plant installed nameplate capacity of 216 megawatts. This technology, while commercially available, is advanced as far as what we are seeing developed today, however over the 20-year plan it is quite reasonable to assume this will become the majority (see figure above on wind turbine size trends over the past two decades). Across the three reference plants, we have estimated the same overnight capital cost. While there are likely cost and labor differences among the states and sites, the delta is not significant. The reference plant assumes all surrounding infrastructure and necessary equipment are included in the cost, for example all in-plant electrical and control systems, on-site roads, meteorological towers buildings, step-up transformers, switchgear and interconnection facilities, and security, control, and maintenance facilities.
Onshore Wind: 2021 Power Plan Reference Plants
| Reference Plant | Wind - Columbia Gorge | Wind – SE Washington | Wind - Montana |
| Technology Type | 3.6 MW, 105m hub height | 3.6 MW, 105m hub height | 3.6 MW, 105m hub height |
| Configuration | 60 x 3.6 MW wind turbine generators | 60 x 3.6 MW wind turbine generators | 60 x 3.6 MW wind turbine generators |
| Nameplate Capacity (MW) | 216 MW | 216 MW | 216 MW |
| Location | Columbia Gorge | SE Washington | Montana |
| Avg. Annual Capacity Factor | 39.8% | 41.2% | 45.5% |
| Round-trip Efficiency | – | – | – |
| Heat Rate – HHV (Btu/kWh) | – | – | – |
| Economic Life (Years) | 30 | 30 | 30 |
| Tax Benefits | – | – | – |
| Financial Sponsor | IOU | IOU | IOU |
| Development Period (Yrs) | 1 | 1 | 1 |
| Construction Period (Yrs) | 1 | 1 | 1 |
| Earliest In-Operation Date | 2021 | 2021 | 2021 |
| Overnight Capital Cost ($/kW) | $1,450/kW | $1,450/kW | $1,450/kW |
| All-in Capital Cost ($/kW) | $1,525/kW | $1,525/kW | $1,525/kW |
| Fixed O&M Cost ($/kW-yr) | $30/kW-yr | $30/kW-yr | $30/kW-yr |
| Variable O&M Cost ($/MWh) | $0/MWh | $0/MWh | $0/MWh |
| Transmission | BPA P2P Long-term Firm | BPA P2P Long-term Firm | PSE CTS + MT Int + BPA P2P |
| Deferred Transmission and Distribution ($/kW-yr) | – | – | – |
| Maximum build-out (MW) | 1,944 MW (9 units) |
1,944 MW (9 units) |
5,400 MW (25 units) |
*All costs in 2016 year dollars. For more details and definitions of resource attributes, see Definitions of Reference Plant Components.
Maximum buildout: The maximum buildout potential for wind resources follows the methodology with some limitations based on estimates of realistic developable potential in the reference plant locations.
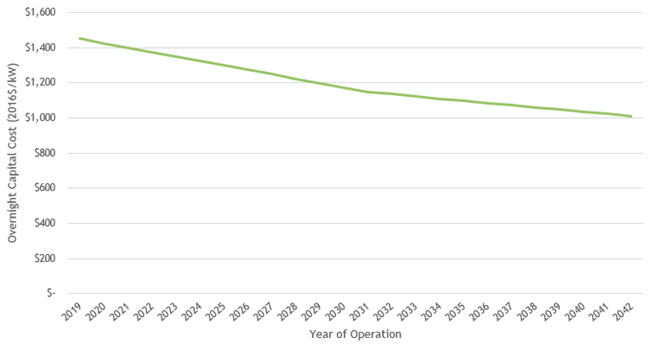
Forward capital cost curves: The overnight capital cost of the onshore wind reference plants is projected to decline just over 30% - from $1,450/kW in 2019 to $1,010/kW in 2042. The de-escalation is based on the 2019 NREL ATB, land-based wind - Mid projection.
Onshore Wind – Capital Cost (2016$/kW)
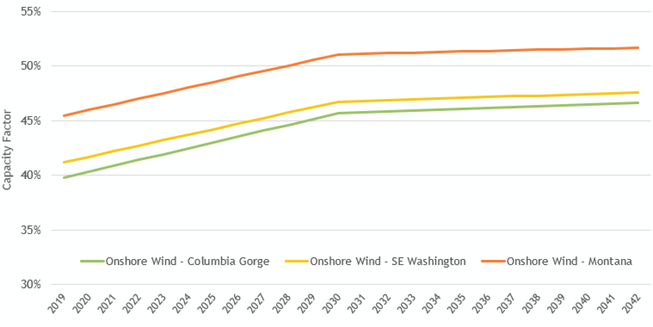
Forward capacity factor improvements: The annual average capacity factor for each onshore wind reference plant location is simulated from data in the NREL SAM model. From this starting point with 2019 vintage technology, a forward capacity factor multiplier is applied to reflect improvements in technology (greater hub height and rotor diameter) for reference plants that are selected to be built throughout the 20-year planning horizon. For example, if a SE Washington wind plant is selected to be built in 2027, rather than assume the capacity factor from 2019, the model would assume the improved capacity factor from 2027. The capacity factor improvements are based on similar locations/wind shapes from the NREL 2019 ATB data. Over the next decade, capacity factors are estimated to increase about 0.5% each year, before leveling off to a more modest .08% improvement from 2030 onwards. At the end of the planning period, onshore wind capacity factors are estimated to improve between 6 - 7%.
Onshore Wind Forward Capacity Factor Improvement Rates
More information: For background analysis, see the initial presentation on onshore wind reference plants from the October 2019 GRAC meeting. Please note that some of the material in the presentation may have been updated between that meeting and the draft plan. In addition, see the capital/FOM/VOM cost workbooks for all resource reference plants as well as MicroFin for supplementary inputs and analysis
[1] https://emp.lbl.gov/webinar/utility-scale-wind-and-solar-us