


The resource buildout of the western grid used to support the organized markets scenario pricing and analyses incorporates many of the common assumptions that are used throughout the scenario work but uses only one planning reserve margins for the whole western grid and removes wheeling charges[1].
The associated buildout is smaller than the baseline. Builds of all resources except storage are lower than the baseline. This study does still build a fair amount of zero or lower emissions resources early but primarily because they have lower production and fixed costs.
Organized Markets buildout

The buildout in the WECC-wide emissions pricing study included just under 290 gigawatts of nameplate build by 2041 as seen in the figure above. More than 24% of the new resource buildout was either stand-alone solar or solar plus battery hybrid resources, and over 50% of the buildout was solar or wind. Like in the baseline, significant amount of the renewable buildout appears to be to attempt to meet the policies enacted by states or municipal governments, and/or goals by utilities.
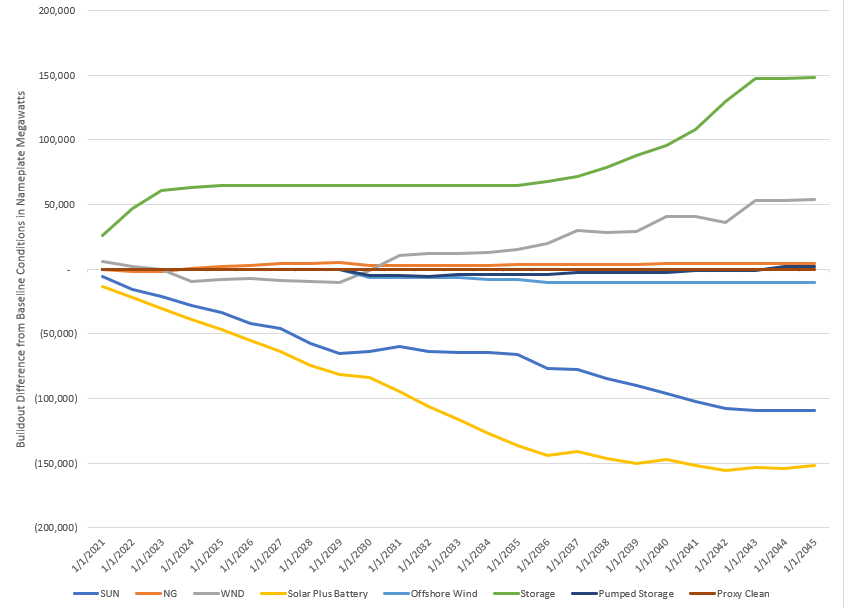
As can be seen below, significantly less stand-alone solar and hybrid solar plus storage, but significantly more wind and short duration storage is built throughout the study. This seems to imply that the buildout[2] would likely be less and more diverse when there is more regional coordination and less variable cost barriers to the sharing of resources, when comparing results to the baseline buildouts[3].
Build Comparison to Baseline
Like the baseline, but to a significantly lesser extent, a large amount of renewable generation is built, causing renewable curtailment[4] to become more prevalent throughout time, especially during midday hours. In 2021, as can be seen in the graph below, the maximum renewable generation curtailment in any hour of the day averaged just under 16 megawatts and by 2041 grew to over 28,000 megawatts. This is significantly less renewable curtailment in the organized markets study than in any of the other studies.
Renewable Curtailment

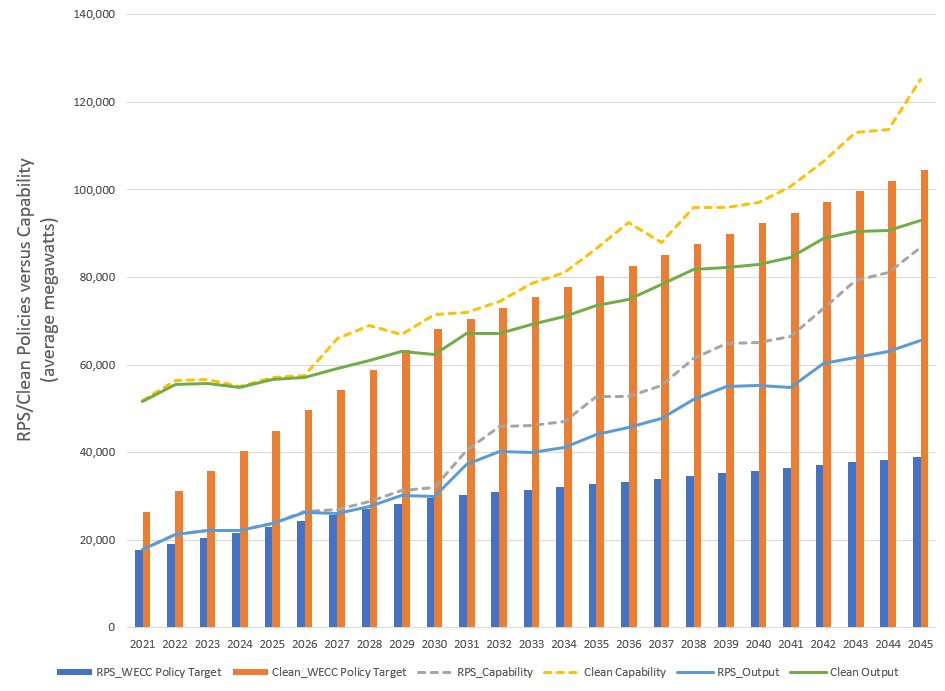
Even with less renewable curtailment than some other studies it was still challenging to enforce compliance with some of the clean policies and goals with the current technologies as can be seen in the graph below. By 2030, with current system operations,[5] transmission infrastructure and the assumed buildout the system is forecasted to not be able to meet all of obligations implied by the clean policies and goals[6] even though the buildouts contain sufficient capability to generate that much power. The state renewable portfolio standards are met for almost all years of the study.
Clean Policy Versus Capability
The following spreadsheets contain further supporting information on the organized markets scenario buildout:
Buildout Information for Organized Markets Scenario
Buildout Comparison to Baseline Conditions
Renewable Curtailment in Organized Markets Scenario
[1] This buildout does not test any other common features of an organized market nor is it modeled after any particular current organized market.
[2] Especially the renewable buildout
[3] Since we know that planning reserve margins were not adhered to in this run, there is little incentive for the model to build for adequacy.
[4] Renewable power is often limited by how much “fuel”, insolation and wind, is available at any given time. Sometimes, more power is generated than is needed, or can be sunk to the grid due to transmission, demand or operational constraints on other generators. In this case, the power is “curtailed” or “spilled.”
[5] It is possible that revised system operations or different policy structure might reduce renewable curtailment, but the current market structure is devised to reduce production cost not to eliminate emissions.
[6] From a physical compliance inside the WECC perspective, there may be alternative compliance methods. This scenario in particular would have to leverage heavily on these alternative measures to meet state policies and obligations.