


Part of the process of developing the power plan is to forecast the economic and demographic drivers that impact the use of energy in the Northwest. The 2021 Plan forecast generally has seen a slower forecasted regional growth that what was projected in the previous power plan.
Summary of Key economic drivers and comparison to previous plan
| Average Annual Growth Rate | 7th Plan 2015-2035 | 2021 Plan 2020-2040 |
| Population | 0.9% | 0.7% |
| Square Feet of Residential Space | 1.19% | 1.09% |
| Square feet of Commercial Space | 1.20% | 1.11% |
| Value of Industrial Production | 1.06% | 0.74% |
| Value of Agricultural Production | 0.81% | 1.41% |
To better forecast the regional energy use, we break down our economic and demographic forecasts into sector-level forecasts. Each sector has different drivers that are predictive of the amount of energy that will be used in that sector. For example, in our forecast of energy use in the commercial sector we predominantly look at the square footage of commercial space in the region. Whereas in our industrial forecast we look at the value of the industrial output from the region.
There are many different economic and demographic data that are collected by federal and state government. Here we focus particularly on which of these data we use in forecasting energy use and other downstream or associated analysis like the energy efficiency supply curves.
The national economic models driving the regional forecast of the 2021 Power Plan were updated as of the fourth quarter of 2018.
Economic and Demographic Drivers for Energy Use by Sector
Residential Sector
The number of dwellings is a key driver of energy demand in the residential sector. Residential demand begins with the number of units, including single family, multifamily, and manufactured homes. The “number of homes” category is driven by regional population, house size, and composition of the population.
Population
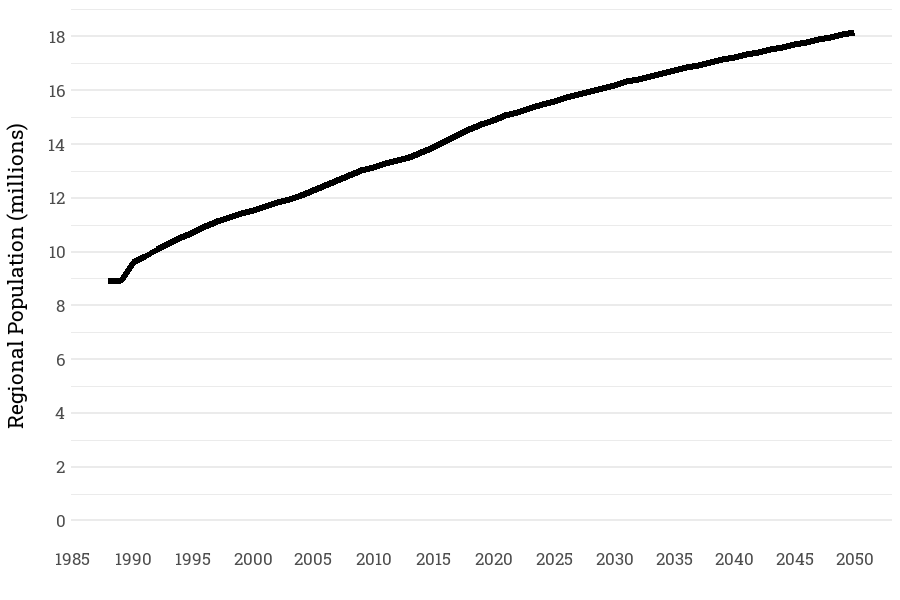
The region’s population increased from about 8.9 million in 1985 to about 15 million by 2020 and is projected to grow to over 17 million by 2040 at an annual rate of 0.7 percent between 2020 and 2040. The underlying detail in our population forecast breaks out the changes based on births, deaths, and migration for the states of Idaho, Oregon, Montana, and Washington.
Population Forecast
In our forecast of the housing stock, we look at the number of residences that we currently have constructed in the region and how many residential units will be added as the regional population increases.
Population, Residential Units and Persons per Residence
| 2017 | 2020 | 2021 | 2025 | 2040 | 2050 | |
| Population (1000s) | 14,343 | 14,905 | 15,060 | 15,605 | 17,240 | 18,166 |
| Residential Units (1000s) | 6,157 | 6,414 | 6,501 | 6,833 | 7,968 | 8,689 |
| Persons per Residential Unit | 2.33 | 2.32 | 2.32 | 2.28 | 2.16 | 2.09 |
Residential units include single-family and multi-family units. To forecast space heating and cooling requirement in residential sector, we use a forecast of square footage of residential sector rather than number of residential units. Smaller home sizes reduce need for space conditioning and lowers demand for energy.
Personal Income
Personal income impacts energy consumption in two ways. First in the short terms, a decline in personal income causes a short-term reduction in energy use. Second, personal income also drives passenger vehicle demand. Regional personal income, both in total and on a per-capita basis, has been on the upswing and is projected to continue, although at a slower rate.
Personal Income (Billions of $2016 dollars)
| 1985 | 2017 | 2022 | 2027 | 2041 | 2050 | AAGR[1] 1985-2017 | AAGR 2022-2041 | |
| ID | 23 | 69 | 78 | 88 | 125 | 157 | 3.5% | 2.5% |
| MT | 19 | 45 | 51 | 56 | 74 | 90 | 2.8% | 2.1% |
| OR | 70 | 189 | 217 | 242 | 329 | 408 | 3.2% | 2.4% |
| WA | 128 | 410 | 476 | 530 | 737 | 940 | 3.7% | 2.5% |
| Four States | 239 | 713 | 822 | 916 | 1,265 | 1,595 | 3.5% | 2.5% |
Commercial Sector
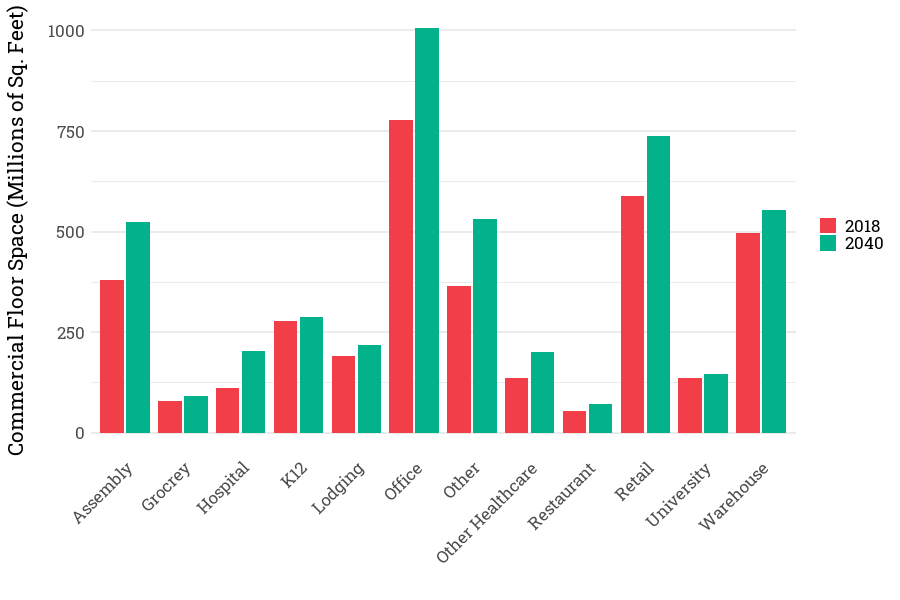
The key driver for the commercial sector’s energy demand is the square footage needed for commercial enterprises. We forecast the space requirement of thousands of business activities and aggregated these into 17 different building types.
Commercial Floor Space
Our forecast for commercial floor space requirements shows increasing needs in most sectors but that growth differs by the commercial business types.
Commercial Floor Space Forecast
Industrial Sector
Demand for energy in the industrial sector is driven by the demand for goods and products produced in the region. Historically, demand for electricity in the industrial sector was dominated by a few large energy-intensive industries. However, the regional mix of industries has been changing toward less electricity and industries with higher value-added products. Economic drivers of energy use in the manufacturing sectors are product output or employment depending on the sector.
Estimated Growth in Product Output
The demand for energy consumed in each industry is forecast using the estimated growth in the product output in that industry. Output in each industry starts with forecast from Global Insight, then it is modified based on feedback from Demand Forecast Advisory Committee. The following table reflects historic and forecast average annual growth rate for manufacturing.
Average Annual Growth Rate Manufacturing Output in Constant 2016 dollars
| 1985-2017 | 2022-2027 | 2022-2041 | |
| Idaho | 2.2% | -0.2% | -1.0% |
| Montana | 1.8% | -3.5% | -2.9% |
| Oregon | 3.5% | 1.5% | 0.6% |
| Washington | 2.1% | 0.9% | 1.0% |
| Region | 2.6% | 1.0% | 0.7% |
Industrial Employment Forecast
Industrial employment peaked at about 650,000 in 2000. During the 2000-2010 period, employment declined to 560,000 employees. Employment is projected to pick up to about 580,000 employees by 2027. Through 2050 industrial employment is projected to remain at around 582,000 to 586,000 employees.
Agricultural Sector
Agricultural Output
Agricultural sector, covering traditional farming and dairy is expected to grow to over 24-28 billion dollars by 2040-2050.
| Billions of $2016 | 1985 | 2017 | 2022 | 2027 | 2041 | 2050 |
| Agricultural Output | 10 | 17 | 19 | 20 | 24 | 28 |
These totals exclude revenue from recreational cannabis in states of Oregon and Washington. Estimates of current and forecast demand for electricity in cannabis production submarket is discussed in the Energy use Forecast.
Transportation Sector
There are two key economic drivers impacting transportation sector. For Passenger vehicles, population is the key drivers. For medium and long-haul freight, commercial, industrial and agricultural output is used as key driver. For off-road transportation output from agricultural, construction and mining is used as the driver.
Incorporating Climate Change into the Economic and Demographic Forecasts
Forecast of energy use in the 2021 Power Plan includes primary and secondary impacts of climate change on economic drivers. The primary impacts , including temperature and precipitation, do not impact the economic and demographic forecasts. But there are secondary impacts incorporated into our economic and demographic forecasts . Examples of these impacts include adjustments to migration and population and increasing the forecast of air conditioning saturation in residential units.
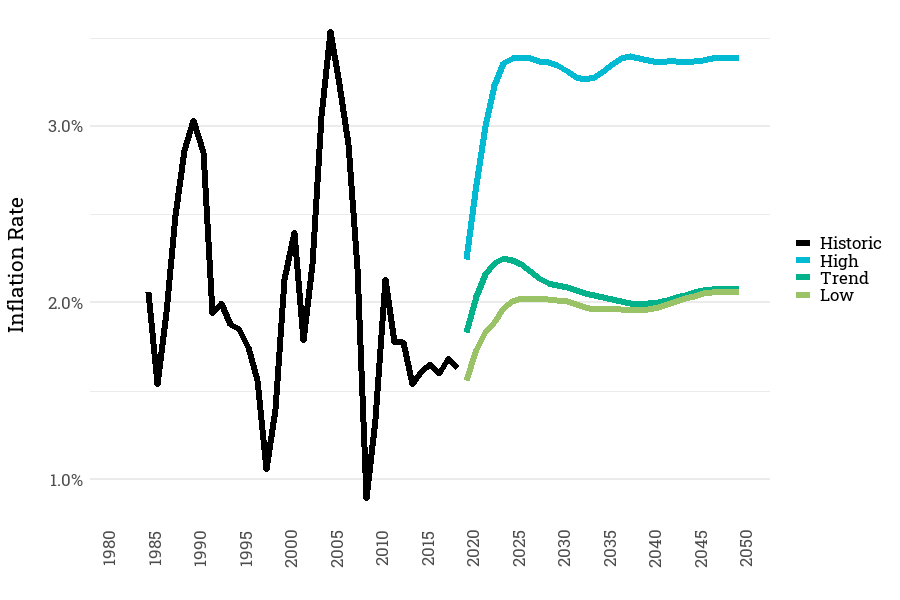
Forecast Inflation Rates
The general trend in inflation is assumed to be about 2% per year over the forecast period, starting with slightly higher inflation in the 2020-2027 period. To capture variations in future patterns of economic growth, three different inflation rate trajectories are considered. An optimistic forecast has a low inflation rate, below 2 percent in the near term, then increasing to 2 percent. For the pessimistic outlook, inflation rates quickly climb to over 3 percent then stay at 3 percent.
Annual Inflation Rate
[1] Annual Average Growth Rate