


Utility-scale Solar Photovoltaic (PV)
Jump to: Trends, Considerations, and Resource Potential | Description of Reference Plant
Solar power is a naturally occurring, renewable resource that converts energy from the sun (solar radiation) into electricity. There are two main types of utility-scale solar electricity generating technologies: solar photovoltaic (PV) and concentrated solar power (CSP). For the 2021 Power Plan, utility-scale solar PV is a primary resource with two distinct geographic reference plants. CSP, often referred to as the “solar power tower”, is not a resource with potential in the region and therefore was not considered as part of the analysis.
Solar PV installations consist of PV cells assembled into modules, ground-mounted (as opposed to rooftop) on panels to fixed-tilt or tracking systems (single or dual axis). The electricity is generated in direct current (DC) and therefore is fed through an inverter to translate the electricity output to alternating current (AC). From the inverter it is connected to the electricity grid through a transformer and substation. PV modules are typically manufactured from semiconductor materials, including the more commonly used crystalline silicon (c-Si) and cadmium tellurium (CdTe). Fixed-tilt are stationary installations, permanently set at an optimum angle in order to absorb the most solar radiation. Tracking systems allow for the modules to rotate on a single or dual axis, effectively “tracking” the greatest solar radiance throughout the day. While the range in spatial acreage can vary based on each project design and logistics, a basic rule of thumb is that 1 megawatt capacity of solar PV tends to equal about 5-7 acres of land.
NREL Illustration of Typical Ground-Mounted Utility-Scale Solar PV Installation

* Illustration from NREL “Facility Scale Solar Photovoltaic Guidebook” for the Bureau of Reclamation, September 2016
Behind-the-meter (otherwise known as distributed) solar PV is often constructed on residential and commercial rooftops with energy consumed directly by the end-user. The Council analyzed and included distributed generation as part of its load forecast, determining how much has been built due to consumer choice (and how much is expected to be built in the future) – irrespective of utility economics. Bulk behind-the-meter solar PV is not explicitly modeled as a new generating resource reference plant; however, the plan does encourage utilities and regional entities to explore the suitability and efficacy of additional alternative cost-effective resources – including distributed generation, most commonly in the form of rooftop solar. Some utility integrated resource plans have recently identified distributed generation as part of their resource strategies going forward.
Solar PV Trends, Considerations, and Resource Potential
Jump to: Technology Trends | Cost Trends | Development Trends | Environmental Effects | Resource Potential in the Region | Opportunities and Challenges
The following section describes high level trends in technology, cost, and development for solar PV. In addition, it identifies resource potential in the region, opportunities and challenges, and environmental effects.
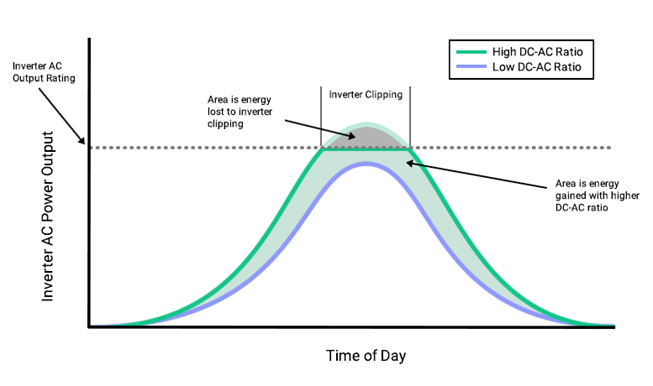
With module prices low (see Cost Trends in the section below), developers are taking advantage of the cost savings by overbuilding the module capability relative to the inverter capacity rating in order to capture more shoulder energy and increase the overall output. This also leads to an increase in the annual average capacity factor. The ratio between the DC output from the solar PV modules to the AC output of the inverter is known as the inverter loading ratio (ILR). As the ILR increases, there may be seasonal peak clipping when the inverter rating surpasses the output - as shown in the shaded portion of the illustration below. This is done by derating the solar modules in real-time so the inverter is never overloaded. Note that this is not market curtailment. It is energy that cannot make it on to the grid due to maximum power limitations of the inverter at the solar plant itself. It could potentially be captured through a DC-coupled battery storage system, described in the solar PV + battery reference plant. Inverter clipping is subject to seasonality and only occurs during certain times of the day when solar radiance is at its peak.
Example of Low and High Inverter Load Ratio (DC-AC Ratio)
The magnitude of energy loss due to clipping differs depending on the amount of overbuild. The figure below shows percentage of energy loss on an annual basis for sites in the region. When the inverter loading ratio is aligned, there is no energy loss. However, as you increase the IRL, the magnitude of energy loss increases as well. As an example, if there is a 100-megawatts solar PV installation with a 1.4 inverter loading ratio (meaning there are 140-megawatts capability on the module side) located in Christmas Valley, Oregon (a location with a fairly high capacity factor for the region), on average about 15% of the potential energy output will be clipped on a yearly basis. If the same installation was located in an area with a lower annual average capacity factor, like Chehalis, Washington, the energy loss at 1.4 IRL is closer to 7%.
Energy Loss Due to Clipping vs. Inverter Load Ratio

* Data from NREL’s SAM tool
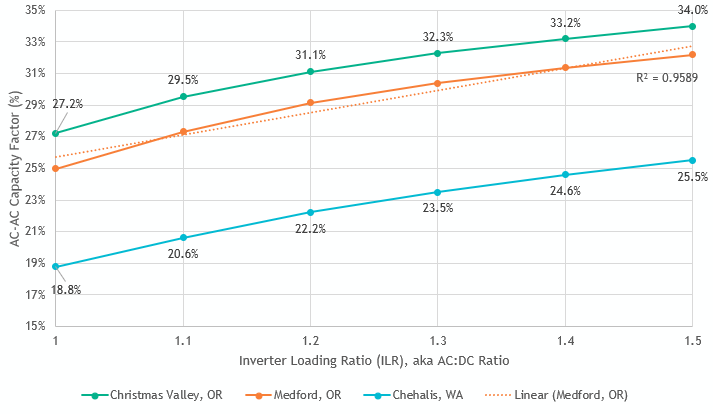
Determining how far to overbuild the modules in relation to the inverter to maximize output is very important as there is a point where it is no longer efficient and economical. The higher inverter loading ratio means that the installed capital cost ($/kW) is higher (more modules are being purchased), however there is more energy output (higher capacity factor) so the levelized cost ($/MWh) is lower. As illustrated by the figure below, the energy benefit of increasing the inverter loading ratio is about linear (or better) for values between 1.0 and 1.4, then they begin to diminish. Over the past decade, according to an LBNL report, the average ILR for projects installed annually has increased from about 1.2 in 2010 to over 1.3 in 2017.
Capacity Factor vs. Inverter Loading Ratio
* Data from NREL’s SAM tool
Additional technology trends are based off of equipment choices. Selecting a tracker system (where the module is able to rotate on a single or dual axis to follow the greatest solar radiance throughout the day) has gained popularity over the past decade and is now the dominant mounting type of choice across the United States. A single-axis tracker typically is able to increase the capacity factor of a location by several percentage points (depending on location and strength of radiation) over a fixed-tilt installation. Crystalline silicon modules have also been preferred, especially over the last 5 years of installations.
LBNL: Annual (columns) and Cumulative (areas) Utility-Scale PV by Module and Mounting Type
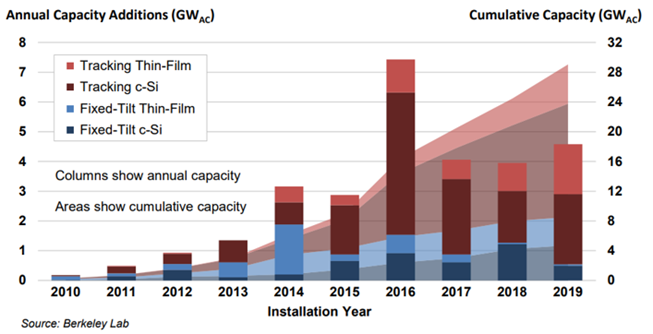
* Figure from LBNL’s Utility-Scale Solar Data Update: 2020 Edition
In the Pacific Northwest, although we have less installed solar PV data to determine trends, there is a tendency to install single-axis tracking systems over fixed-tilt mounted systems. This makes sense in our region as we tend to have lower solar radiance (as compared to the desert Southwest, for example) so utilizing a technology that can track and capture more energy from the sun increases energy output. See the existing system solar PV for more information. In addition, see the Council’s project database for individual operating and proposed project specifications.
PNW Installed Solar PV, by Mounting Type
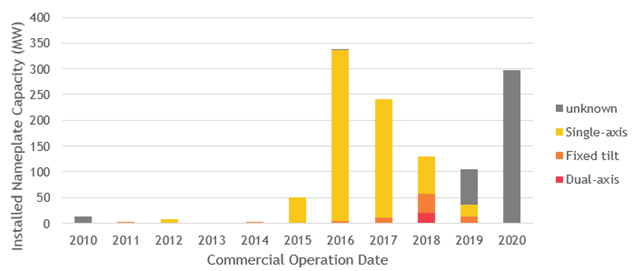
* Data from the Council’s generating resources project database
Another trend to watch for over the next few years is the emergence of bifacial solar PV modules. These modules have solar cells on the front and back in order to capture the diffused solar radiation that bounces off of the ground. Utilizing bifacial modules could boost energy output by up to 10% (according to several preliminary studies).
The installed cost of utility-scale solar PV has declined significantly since the first major installations in the late 2000’s and early 2010’s. According to a Lawrence Berkeley National Lab report, over the past decade, the median installed cost of utility-scale solar projects has declined about 70%. A National Renewable Energy Lab report documenting solar PV component cost reductions using an aggregated bottom-up approach finds cost per watt (DC) for both fixed-tilt and single-axis trackers to have dropped about 80% since 2010. This dramatic decline in solar costs has been driven by efficiencies and improvements across all components, in particular the module (panel), hardware, and soft costs. See graphic from NREL report below (the left axis is 2019 year dollars per watt).
NREL Installed Utility-Scale PV Component Cost Reductions ($/Wdc)
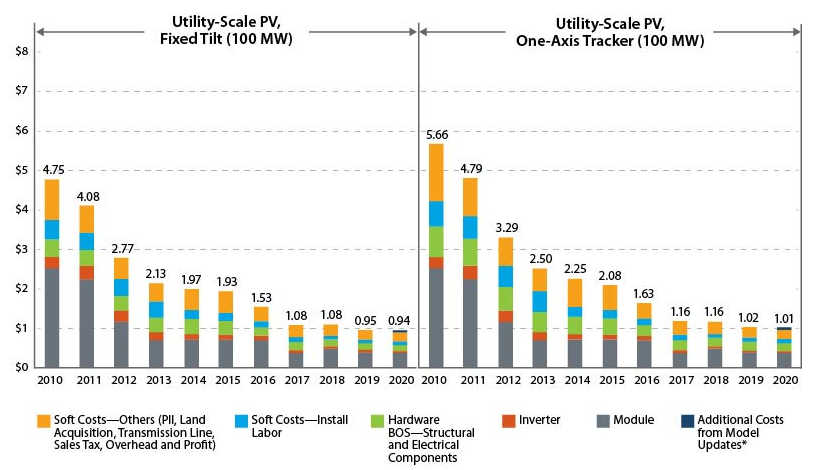
* Graphic from NREL’s “U.S. Solar Photovoltaic System and Energy Storage Cost Benchmark: Q1 2020,” January 2021
Modules have been decreasing in cost while also increasing in efficiency – improving the modules’ conversion of sunlight to energy – and reducing the number of modules needed in an installation (or providing enough cost savings to strategically increase the inverter load ratio and therefore increase energy output). Soft costs – which include direct labor and installation, siting & licensing, land acquisition, financing, and overhead, among other items – have also decreased significantly as the learning curve has helped streamline the development process and project design.
The steep decline that occurred between 2010 and 2017 seems to have leveled out (though still decreased) over the past four years. Despite recent price fluctuations due to tariffs on imported materials and cells, the cost of solar PV is expected to further decrease in the future. Forecasts for future cost declines average 2-3.5% in real dollar terms over the next 20 years, typically with higher projected declines in the earlier years.
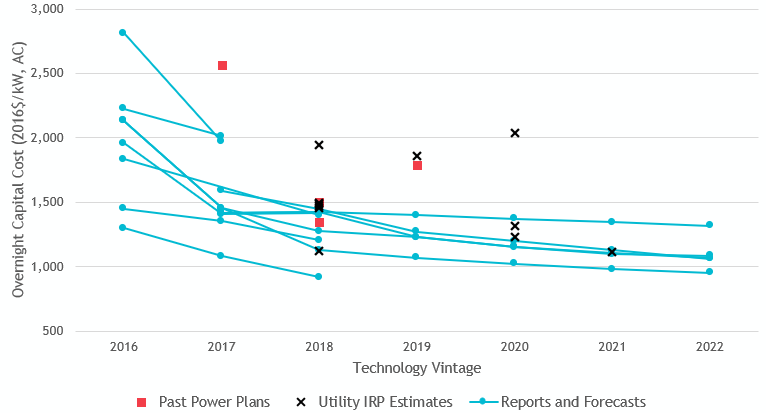
The figures below show the data plots and analysis that were used to develop the 2021 Power Plan reference plant cost estimates. Note that these figures captures data from various solar PV capacities, configurations, and technologies. The first figure reflects the significant cost decline of solar PV in the early-to-mid 2010’s. The second figure is the same data, only parsed to zoom in on the year 2016 and beyond.
Overnight Capital Cost of Solar PV: Historical Trajectory
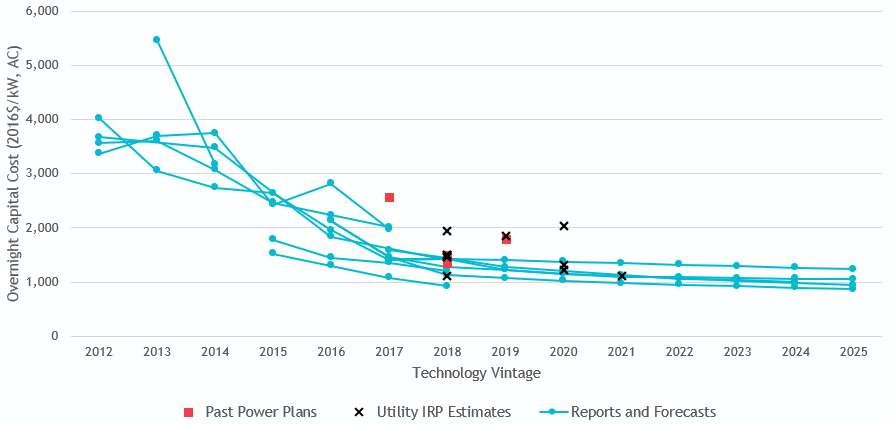
Overnight Capitol Cost of Solar PV: 2016-2022
The past few years have seen substantial installations of solar PV across the United States, and that trend is projected to continue. With clean energy polices enacted across the western interconnect, the development of solar PV within the WECC in particular is expected to be significant. In the Pacific Northwest, there has been modest development of solar PV to-date. Oregon has the most solar PV in operation as of 2020, followed by Idaho. The size of projects has also increased, from small 2-5 megawatt projects to larger 20-100 megawatt developments. See Proposed Resource Development over the Next Decade for a snapshot of solar resources in the development pipeline.
In addition, some of the more recent solar project developments have been spurred on by corporations directly acquiring renewable energy (without purchasing through a utility) as part of their clean energy initiatives and commitments. In order to preserve corporate customers, utilities have begun offering green power initiatives to secure renewable energy on behalf of their large customers.
Installed Solar PV Capacity, by State
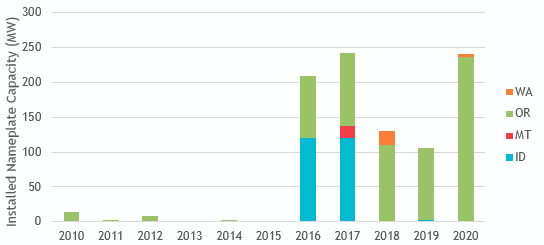
* Data from the Council’s generating resources project database
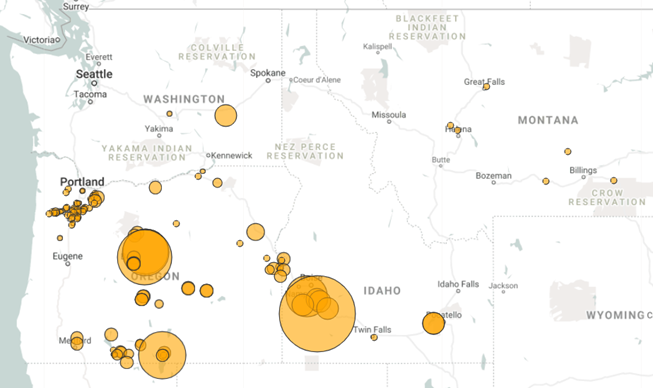
The projects developed in the region thus far are fairly congregated east of the Cascades in Oregon, along the lower Snake River near Boise in Idaho, and a smattering of small projects in the Willamette Valley (where projects cannot exceed 12 acres due to regulations on high value farmland). See the Council’s project database for individual project specifications, and the Council’s project map to explore the region’s developments.
Map of Solar PV Installations in the Pacific Northwest
See the Environmental Effects of Generating Resources for a high-level summary of some of the primary environmental effects of utility-scale solar PV. For an in-depth description of the lifecycle impacts associated with electricity generation, see Appendix I of the Seventh Power Plan.
The solar PV reference plants considered and assessed by the Council for the 2021 Power Plan are assumed to comply with existing environmental regulations governing air and water emissions, siting regulations, waste disposal, and fish and wildlife protection and mitigation costs when quantifiable and directly attributable to the new resource. Extensive environmental impact statements throughout the siting and licensing process as authorized by FERC are accounted for in the overall project cost. For more information, see the section on Federal Statutes and Regulation Updates and the Methodology for Determining Quantifiable Environmental Costs and Benefits and Due Consideration.
Resource Potential in the Region
Undoubtably the solar resource is strongest in the United States desert Southwest and southern California, as demonstrated by the LBNL map below reflecting annual average daily solar energy (kWh/m2/day) based on historical data. The darker the shade, the greater the resource. However, solar PV projects have been developed all across the United States, including in the Pacific Northwest where there are about 950 megawatts solar capacity in operation across the four states. While installations have been modest in the region thus far (compared to elsewhere in the United States), the development pipeline is brimming with proposed projects and solar PV is posed to be a competitive new generating resource option over the next decade and beyond.
LBNL Map: Solar Resource Potential and Installed Solar PV Projects
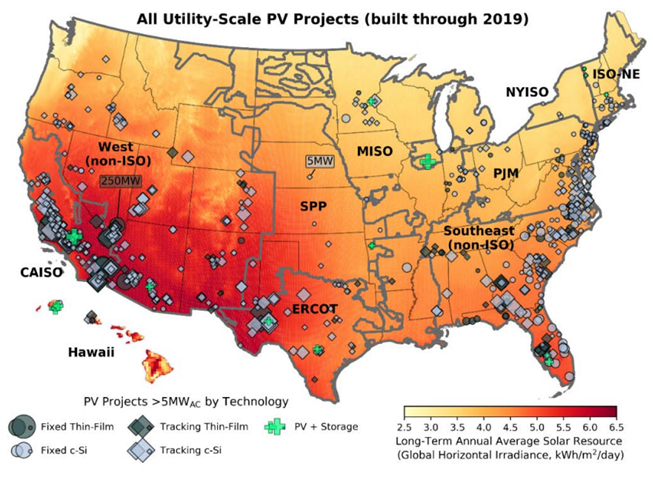
* Map from LBNL’s “Utility-Scale Wind and Solar in the U.S.: Comparative Trends in Deployment, Cost, Performance, Pricing, and Market Value,” 12/8/20
The greatest potential for utility-scale solar PV development is in the higher capacity factor regions in southern Oregon and east of the Cascades (primarily eastern Oregon and southern Idaho). In the chart below, staff estimated capacity factors for locations throughout the region using the NREL SAM model. There are land-use regulations in some counties and states that limit the potential in the region and access to transmission from the more rural developments to load centers may further limit development.
Capacity Factors for 100MWac, Single-Axis Solar PV Installations, w/ 1.4 Inverter Load Ratio
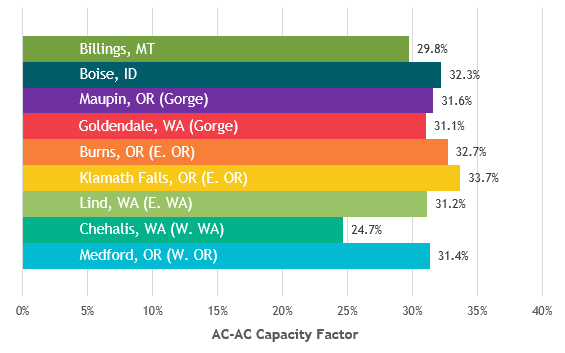
* Data from NREL’s SAM tool
There are significant opportunities for low-cost solar PV development in the region, but also some challenges as well – including long-term firm transmission access, land-use regulations and moratoriums, and uncertainty over the cumulative effects of significant renewable development on the environment and cultural resources.
With clean energy policies and renewable portfolio standards enacted in Washington and Oregon, and utilities and communities adopting clean energy goals across the region, there are substantial opportunities for new solar resources to compete with other carbon free resources to meet those goals. In addition, the region is losing 60% of its coal fleet over the next decade and replacement resources will be needed to complement the existing system and meet demand.
In certain areas of the region, there are strict land-use regulations and temporary moratoriums on new solar PV development. Per the Land Conservation Development Department in Oregon, solar PV developments cannot exceed 12 acres when cited on high value farmland. In general, one megawatt of solar PV capacity needs about 5-7 acres, and thus this ruling has resulted in a scattering of 1.5-2.5 megawatt projects throughout the Willamette Valley. In 2017, Kittitas County in Washington adopted a temporary moratorium, banning new solar PV development. Tensions between counties and landowners in high solar resource areas is a serious consideration about which utilities and developers need to be thoughtful. Least-conflict siting is one approach to intentionally and deliberately work with local landowners and communities to mutually identify prospective sites for new development that meet the needs of the developer while also minimizing conflicts with the local communities. See more information below on how this can be incorporated into the siting of prospective projects.
Access to long-term firm transmission could be a limiting factor for new solar development in some locations in the region. New resources may face transmission access queues up to several years, creating a barrier to, or slowing, development. However, as evidenced by the Council’s transmission utilization analysis, it is common that a given transmission path could be fully contractually reserved on a long-term firm basis, while still having substantial available physical capacity most or all hours of the year. This means that there is often short-term capacity available for generators to purchase to transfer output to the grid. As part of the 2021 Power Plan’s research and development initiatives to support the resource strategy, the Council recommends that the region’s transmission providers work together with regional entities to explore solutions to alleviate new resource development barriers on the existing system in a cost-effective, strategic manner. See the R&D section for more information on this recommendation.
Another challenge is understanding and mitigating for all of the environmental effects and impacts to cultural resources (remains or indicators of past human experiences) when developing any new generating resource of quantity and magnitude. (See the methodology for developing quantifiable environmental costs and benefits for more information on how the Council analyzed and reflected environmental impacts in its power planning analysis.) In the reference plant analysis, the Council captured the costs and characteristics of a single plant, but what about the cumulative impacts of an entire fleet? With expected rapid development of new resources – and in particular new onshore wind and utility-scale solar PV – are there additional considerations that need to be taken into account prior to mass-scale development?
The Council assessed some of the additional factors that come into play when considering a large-scale renewable development in a presentation to the Council in June 2021. There are potential cost-effective, sustainable, and strategic opportunities to mitigate the effects of these sizeable resource deployments and it is up to developers and owners to explore them. One example of an opportunity is to co-locate multiple generating projects (hybrid resources like solar PV plus battery storage) to minimize land and environment disturbances while also utilizing the same infrastructure (substations, roads, etc.) to reduce cost and streamline construction. Another example is to develop dual purpose projects in which a generating resource is paired with a complimentary trade – usually agriculture – to stack the benefits among both endeavors (e.g. raise the solar modules up a few feet to allow for livestock to graze underneath or for crops to grow – known as agrivoltaics, or housing bee apiaries on site and growing wildflowers that encourage pollination). There is also a growing initiative for low-impact solar development. Per the U.S. Department of Energy’s InSPIRE initiative, the goal of low impact solar PV is to purposefully design new developments with minimal impact to the environment that strive to “improve solar health, retain water, nurture native species, and produce food.” Many traditional solar PV developments level the land and remove topsoil in favor of gravel or artificial grass. Low-impact solar PV development would instead preserve the natural habitat and work with it instead of demolishing it.
The siting, construction, and operation of any generating facility has impacts on land and land uses, water resources, wildlife and wildlife habitat conditions, cultural resources, traditional uses, and local landowners and communities. Environmental effects of any proposed development are analyzed as part of state energy siting processes (if on private land) or by state or federal land management agencies (if on public land) through an array of different criteria and procedures. With various levels of siting and licensing regulations and approvals, there may be opportunities to optimize the siting process to help ensure that new, cumulative renewable resource development is carried out in a consistent manner that protects the wildlife, fish, cultural resources, and is inclusive of the local communities and landowners directly affected by new development. Some states and municipalities are including deliberate, strategic outreach and engagement in the siting process with local communities directly impacted by involving them early in the process and collaboratively identifying and mapping out agreed upon least-conflict siting zones ahead of any development. This allows for ownership of the process and support from the community and may include compromises by developers in order to successfully implement new projects. It is also imperative to ensure that tribes are explicitly and thoughtfully consulted with to understand and preserve cultural resources and traditional uses in the vicinity of new developments.
Description of Solar PV Reference Plant
There are two utility-scale solar PV reference plants, differentiated by size and location. The first is a smaller 15-megawatt (alternating current) solar PV installation located in Western Washington (while a lower solar resource area, this location is close to load and retiring thermal units) using monocrystalline silicone PERC modules mounted on single axis trackers. The second is a larger 100-megawatt (alternating current) solar PV installation located east of the Cascades (representing areas with high solar irradiance east of the Cascades and in Southern Oregon) and monocrystalline silicone PERC modules mounted on single axis trackers. Both reference plants have an inverter loading ratio of 1.4, boosting their annual average capacity factors. The larger 100-megawatt reference plant costs about 9% less than the smaller 15-megawatt plant, capitalizing on cost benefits due to economies of scale. The expected fixed operations and maintenance (O&M) include inverter replacements at 15 years, along with periodic cleaning of the modules. The reference plant assumes all surrounding infrastructure and necessary equipment are included in the cost, for example all in-plant electrical and control systems, on-site roads, weather stations, step-up transformers, switchgear and interconnection facilities, and security, control, and maintenance facilities.
Solar PV: 2021 Power Plan Reference Plants
| Reference Plant | Solar PV – W. Washington | Solar PV – E. of Cascades |
| Technology Type | Mono PERC c-SI w/ single axis tracker | Mono PERC c-SI w/ single axis tracker |
| Configuration | ||
| Nameplate Capacity (MW) | 15 MWac | 100 MWac |
| Inverter Loading Ratio (DC:AC Ratio) | 1.4:1 | 1.4:1 |
| Location | Western Washington | East of the Cascades |
| Avg. Annual Capacity Factor | 24.7% | 32.5% |
| Round-trip Efficiency | – | – |
| Heat Rate – HHV (Btu/kWh) | – | – |
| Economic Life (Years) | 30 | 30 |
| Tax Benefits | ITC | ITC |
| Financial Sponsor | IOU | IOU |
| Development Period (Yrs) | 1 | 1 |
| Construction Period (Yrs) | 1 | 1 |
| Earliest In-Operation Date | 2021 | 2021 |
| Overnight Capital Cost ($/kW) | $1,465/kW | $1,350/kW |
| All-in Capital Cost (pre-tax benefits) ($/kW) | $1,541/kW | $1,420/kW |
| All-in Capital Cost (w/ tax benefits) ($/kW) | $1,387/kW | $1,278/kW |
| Fixed O&M Cost ($/kW-yr) | $14.55/kW-yr | $14.55/kW-yr |
| Variable O&M Cost ($/MWh) | $0/MWh | $0/MWh |
| Transmission | IOU NT | IOU NT |
| Deferred Transmission and Distribution ($/kW-yr) | – | – |
| Maximum build-out (MW) | 495 MW (33 units) | 10,000 MW (100 units) |
*All costs in 2016 year dollars. For more details and definitions of resource attributes, see Definitions of Reference Plant Components.
Maximum buildout: The maximum buildout potential for solar PV resources follows the methodology with some limitations based on estimates of realistic developable potential.
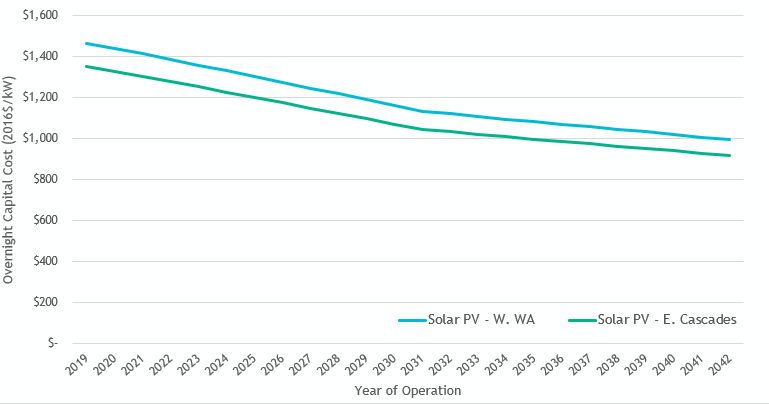
Forward capital cost curves: The overnight capital cost of the utility-scale solar PV reference plants is projected to decline about 32% by 2042. The most significant cost declines occur in the first ten years, followed by a more level decrease starting in 2031. The de-escalation is based on the 2019 NREL ATB, solar PV - mid projection.
Solar PV – Capital Cost (2016$/kW)
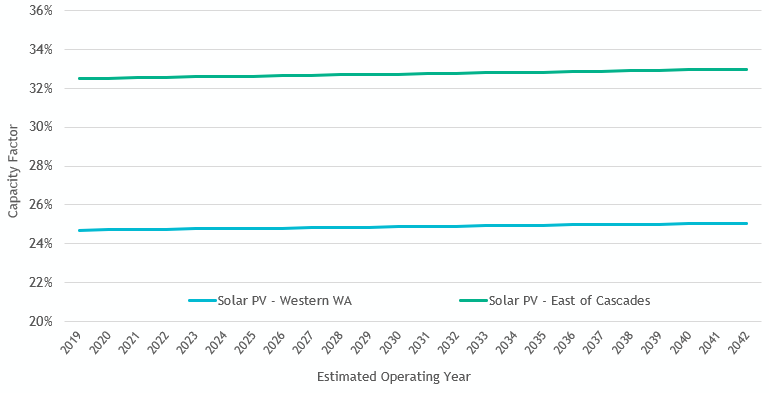
Forward capacity factor improvements: The annual average capacity factor for each utility-scale solar PV reference plant location is simulated from data in the NREL SAM model. From this starting point with 2019 vintage technology, a forward capacity factor multiplier is applied to reflect improvements and efficiencies for reference plants that are selected to be built throughout the 20-year planning horizon. For solar PV, these improvements are very modest (unlike onshore wind). The capacity factor improvements are based on similar locations/solar shapes from the NREL 2019 ATB data. At the end of the planning period, solar PV capacity factors are estimated to improve by just 1%. Keep in mind these capacity factors already take into account the ideal economic and efficient inverter loading ratio (1.4) which optimizes energy output.
Utility-Scale Solar PV Forward Capacity Factor Improvement Rates
More information: For background analysis, see the initial presentation on utility scale solar PV reference plants from the September 2019 GRAC meeting. Please note that some of the material in the presentation may have been updated between that meeting and the draft plan. In addition, see the capital/FOM/VOM cost workbooks for all resource reference plants as well as MicroFin for supplementary inputs and analysis.